

HOT TOPICS LIST
- MACD
- Fibonacci
- RSI
- Gann
- ADXR
- Stochastics
- Volume
- Triangles
- Futures
- Cycles
- Volatility
- ZIGZAG
- MESA
- Retracement
- Aroon
INDICATORS LIST
LIST OF TOPICS
PRINT THIS ARTICLE
by Gary Grosschadl
With 2005 revenues of $2.95 billion, Pentair Inc. is a large player in the industrial sector. The stock's recent thrust higher may continue.
Position: Accumulate
Gary Grosschadl
Independent Canadian equities trader and technical analyst based in Peterborough
Ontario, Canada.
PRINT THIS ARTICLE
CHART ANALYSIS
Pentair Inc. Trying To Bounce
10/31/06 08:18:51 AMby Gary Grosschadl
With 2005 revenues of $2.95 billion, Pentair Inc. is a large player in the industrial sector. The stock's recent thrust higher may continue.
Position: Accumulate
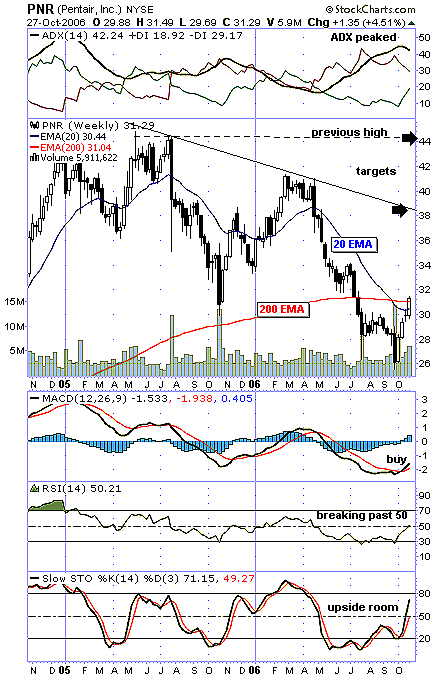
| The weekly chart seen in Figure 1 looks promising for an upleg higher. The bottom near $26 was met with a large volume surge, shaking out a lot of bears. Note the candlestick formation, a harami pattern where the second candlestick is contained within the real body of its predecessor. This often suggests an end to the downleg as bearish forces wane. |
| Two upside targets are considered, the first being trendline resistance near $38 and then the former high near $44. Note how this week's close breaks above two noteworthy overhead moving averages. This will embolden the bulls to a higher level of confidence. |
|
| FIGURE 1: PENTAIR INC., WEEKLY. Upside targets are considered on this chart. |
| Graphic provided by: StockCharts.com. |
| |
| Several indicators are suggesting this bullish upswing could carry higher. At the top of the chart, the average directional movement index (ADX) line appears to be coming off a peak. This may induce the DIs (positive and negative directional indicators) to cross over, giving the bulls the upper hand. Below the chart, three other indicators hold bullish promise. The moving average convergence/divergence (MACD) has flashed a buy signal with its crossover from low levels. The relative strength index (RSI) is just breaking past the often key area of 50, suggesting growing strength. Finally, the stochastic oscillator is showing its own upleg and has also broken through its key 50 area. |
| Going forward, the bulls need to see strength above the 200-period exponential moving average (EMA) as a support level. Another close below this level would swing control back to the bears. Some sideways action in the coming days would not be a surprise, as some of these recent gains may go through a normal period of consolidation. |
Independent Canadian equities trader and technical analyst based in Peterborough
Ontario, Canada.
| Website: | www.whatsonsale.ca/financial.html |
| E-mail address: | gwg7@sympatico.ca |
Click here for more information about our publications!
Comments
Date:�10/31/06Rank:�5Comment:�

Request Information From Our Sponsors
- VectorVest, Inc.
- Executive Premier Workshop
- One-Day Options Course
- OptionsPro
- Retirement Income Workshop
- Sure-Fire Trading Systems (VectorVest, Inc.)
- Trading as a Business Workshop
- VectorVest 7 EOD
- VectorVest 7 RealTime/IntraDay
- VectorVest AutoTester
- VectorVest Educational Services
- VectorVest OnLine
- VectorVest Options Analyzer
- VectorVest ProGraphics v6.0
- VectorVest ProTrader 7
- VectorVest RealTime Derby Tool
- VectorVest Simulator
- VectorVest Variator
- VectorVest Watchdog
- StockCharts.com, Inc.
- Candle Patterns
- Candlestick Charting Explained
- Intermarket Technical Analysis
- John Murphy on Chart Analysis
- John Murphy's Chart Pattern Recognition
- John Murphy's Market Message
- MurphyExplainsMarketAnalysis-Intermarket Analysis
- MurphyExplainsMarketAnalysis-Visual Analysis
- StockCharts.com
- Technical Analysis of the Financial Markets
- The Visual Investor