HOT TOPICS LIST
- MACD
- Fibonacci
- RSI
- Gann
- ADXR
- Stochastics
- Volume
- Triangles
- Futures
- Cycles
- Volatility
- ZIGZAG
- MESA
- Retracement
- Aroon
INDICATORS LIST
LIST OF TOPICS
PRINT THIS ARTICLE
by Paolo Pezzutti
The semiconductor stock printed on Friday the worst performance of the DJIA--is weakness ahead in the short term?
Position: N/A
Paolo Pezzutti
Author of the book "Trading the US Markets - A Comprehensive Guide to US Markets for International Traders and Investors" - Harriman House (July 2008)
PRINT THIS ARTICLE
ASCENDING TRIANGLES
Intel: Intraday Failure Of An Ascending Triangle
10/30/06 02:36:15 PMby Paolo Pezzutti
The semiconductor stock printed on Friday the worst performance of the DJIA--is weakness ahead in the short term?
Position: N/A
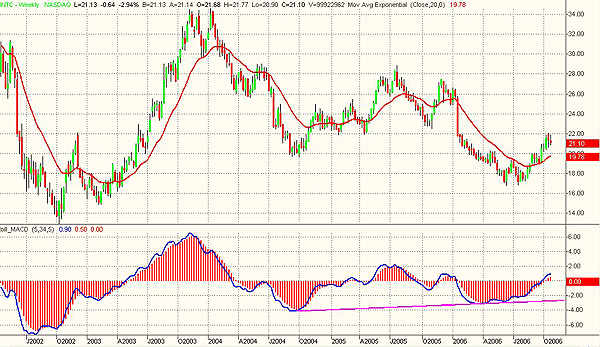
| Intel Corp. (INTC), the world's largest semiconductor maker, led declines among technology stocks and slumped 67 cents, or 3.08%, to $21.10 for the biggest decline in the Dow average on Friday. Goldman, Sachs & Co. cut its growth forecast for circuit boards. News reported that shipments of motherboards will rise 8.8% this quarter, down from an earlier prediction of 10.8% growth. This news could contribute and change the Intel technical picture. The weekly chart (Figure 1) displays that the stock printed a top at the end of 2003 of about $34. The following downtrend provided heavy losses to investors and printed a low during last summer below $17. With prices halved in less than three years, the stock managed to start a reaction to reach the high of $22 on October 10, 2006, during the last three-month up leg. In this time frame, the $22-23 area represent a resistance before the stock can try to close the big gap between $23 and $25 printed on January 19. In the short term, however, my opinion is that the stock would move to the downside, looking at least to retest its supports. |

|
| FIGURE 1: INTC, WEEKLY. Prices have tested the $22 resistance. |
| Graphic provided by: TradeStation. |
| |
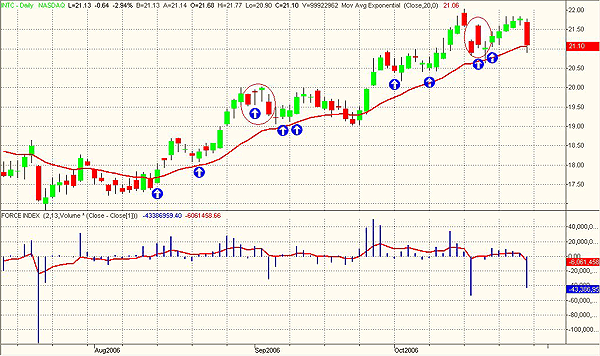
| In the daily chart (Figure 2), you can see that the ongoing up leg could be exploited quite well using the force index indicator. As you know, the indicator provides excellent low-risk entry points in defined trend environments. It takes into account price and volume, printing a positive force in case of a positive close of prices, and a negative force in case of a negative close of prices. The greater the volume and the price change, the greater the force. A positive 13-day exponential moving average (EMA) of the force index provides a longer-term uptrend indication. A two-day EMA will help you spot an entry point when it turns negative, placing a buy order above the high of that day. The opposite is true during a downtrend. In the figure, you can see that the indicator has worked well, providing good entry points during pullbacks and few false indications (circled in red). Now the 13-day moving average has turned negative and the two-day moving average has printed a peak to the downside. Yesterday's drop of prices is the biggest since July 20. Prices are still moving within the rising channel started last July and testing the rising 20-day EMA. However, there are elements to believe that in the short term for the stock there may be weakness ahead. In one single session, Friday's long down candle canceled the progress made in five up consecutive closes. It represents a clear change in the investors' attitude toward the stock. It is true that you may have seen this happen often in uptrends, only to realize that these selloffs were excellent entry points. This time, however, at the end of a long up move, chances are that a longer correction may start. For the moment, in this time frame I would not look to open long position and limit my action to follow the indications of the force index. |

|
| FIGURE 2: INTC, DAILY. The force index indicator helped spot low-risk entry points during the uptrend. Now, the 13-day moving average of the indicator has turned negative, indicating that the up move may be over. |
| Graphic provided by: TradeStation. |
| |
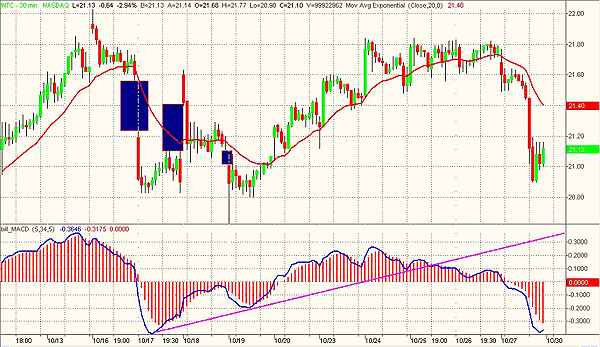
| The 30-minute intraday chart in Figure 3 provides an interesting perspective of the ongoing technical conditions in the short term. On October 19, after a bullish reversal island printed between October 17 and 18, prices attempted a breakout of the formation to the downside, causing its failure and possibly an acceleration of the downtrend. The pattern resulted in a turtle soup during the first 30 minutes of trading on October 19. Prices, in fact, at the open gapped down and spiked to the downside, but eventually entered again the previous trading range printing a long hammer. The closure of the open gap inititiated a new leg of the longer-term uptrend. |

|
| FIGURE 3: INTC, 30-MINUTE. Prices did not manage to retest the $22 previous top. |
| Graphic provided by: TradeStation. |
| |
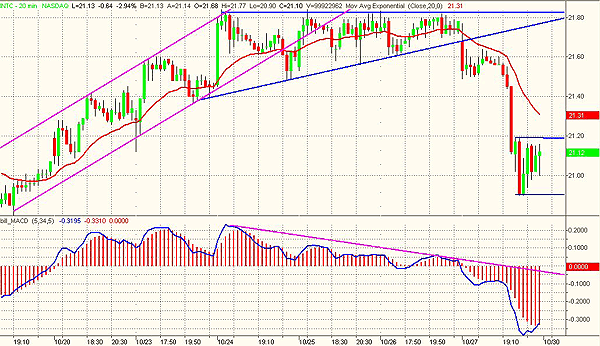
| In Figure 4, I have displayed a 20-minute chart. Here you can see how prices between October 24 and 26 developed a nice bullish ascending triangle. Volatility decreased throughout the formation and prices tested several times the resistance at $21.80. Typically, these triangles are formations that favor the accumulation of long positions before a breakout to the upside and the resumption of the original uptrend. Instead, this time prices printed eventually a fast breakout to the downside at the open of October 27. Typically, a trend day developed that did not allow any significant rebounds during the trading session. During the last six bars, a congestion started to develop and it is still ongoing. In fact, you can see how the last five bars are contained within the range of the so-called measuring bar. |

|
| FIGURE 4: INTC, 20-MINUTE. The breakout of the ascending triangle to the downside displayed an acceleration of prices to the downside. |
| Graphic provided by: TradeStation. |
| |
| In the short term, the technical framework has become negative for the stock. There is a possibility to develop a rebound toward the $21.50 level, but my opinion is that weakness will continue to retest the stock's supports at lower levels. Supports can be identified in the $20-20.40 area. Only a quick move above the $21.80 could resume the uptrend, but at the moment it seems the less likely option. |
Author of the book "Trading the US Markets - A Comprehensive Guide to US Markets for International Traders and Investors" - Harriman House (July 2008)
| Address: | VIA ROBERTO AGO 26 POSTAL CODE 00166 |
| Rome, ITALY | |
| Phone # for sales: | +393357540708 |
| E-mail address: | pezzutti.paolo@tiscali.it |
Click here for more information about our publications!
Comments
Date: 10/30/06Rank: 3Comment:
Date: 10/31/06Rank: 5Comment:
Date: 11/14/06Rank: 4Comment:

|

Request Information From Our Sponsors
- StockCharts.com, Inc.
- Candle Patterns
- Candlestick Charting Explained
- Intermarket Technical Analysis
- John Murphy on Chart Analysis
- John Murphy's Chart Pattern Recognition
- John Murphy's Market Message
- MurphyExplainsMarketAnalysis-Intermarket Analysis
- MurphyExplainsMarketAnalysis-Visual Analysis
- StockCharts.com
- Technical Analysis of the Financial Markets
- The Visual Investor
- VectorVest, Inc.
- Executive Premier Workshop
- One-Day Options Course
- OptionsPro
- Retirement Income Workshop
- Sure-Fire Trading Systems (VectorVest, Inc.)
- Trading as a Business Workshop
- VectorVest 7 EOD
- VectorVest 7 RealTime/IntraDay
- VectorVest AutoTester
- VectorVest Educational Services
- VectorVest OnLine
- VectorVest Options Analyzer
- VectorVest ProGraphics v6.0
- VectorVest ProTrader 7
- VectorVest RealTime Derby Tool
- VectorVest Simulator
- VectorVest Variator
- VectorVest Watchdog
