HOT TOPICS LIST
- MACD
- Fibonacci
- RSI
- Gann
- ADXR
- Stochastics
- Volume
- Triangles
- Futures
- Cycles
- Volatility
- ZIGZAG
- MESA
- Retracement
- Aroon
INDICATORS LIST
LIST OF TOPICS
PRINT THIS ARTICLE
by David Penn
Is there ever a good reason to average down?
Position: N/A
David Penn
Technical Writer for Technical Analysis of STOCKS & COMMODITIES magazine, Working-Money.com, and Traders.com Advantage.
PRINT THIS ARTICLE
RETRACEMENT
Buying The OIH Pullback
10/27/06 03:17:00 PMby David Penn
Is there ever a good reason to average down?
Position: N/A
| Next to letting a gain turn into a loss and cutting your winners short, the idea of averaging down probably is among the top shibboleths in trading. Investors -- especially investors in mutual funds -- often are encouraged to tolerate, or even enjoy, averaging down in their long-term accounts. This is based on the idea that since "stocks in the long run always go up," the occasional corrections are akin to sales on merchandise guaranteed to increase in value over time. |

|
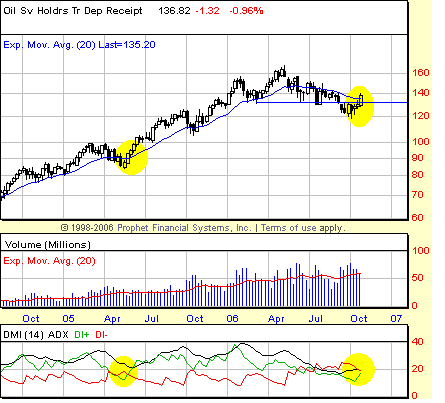
| FIGURE 1: OIL SERVICE HOLDRS, WEEKLY. The last great directional movement buy signal in the weekly OIH charts came back in the late spring of 2005, creating a true summer of love for oil stock bulls. The rightmost ovals highlight the current — potential — opportunity. |
| Graphic provided by: Prophet Financial, Inc. |
| |
| With a guarantee like that, who wouldn't be a fan of averaging down? The problem with averaging down, at least in any time frame other than the 20-odd year time frame usually presumed to be "the long run," is that more often than not, stocks that are going down continue to go down. Moreover, averaging down in the short term is often a justification for not selling a losing position. The idea of lowering the cost basis has a certain "sugar rush" appeal to someone who bought at $50 and has seen his market move to $40. |
| So is there ever a time when it's okay to give in to the temptation to average down when trading? Even if the answer is still "No," there are ways for those determined to average down to find those situations where, if they are wrong, they will at least be able to realize it and act on it quickly. Generally speaking, these opportunities come when there are divergences between longer- (that is, intermediate) and shorter-term charts of the same market. For example, in the weekly chart of the OIH in Figure 1, the directional movement indicator appears on the verge of providing the first intermediate-term buy signal since late May 2005 (there was a buy signal on the weekly charts back in late June of this year, but it was not confirmed by a follow-through higher close). |

|
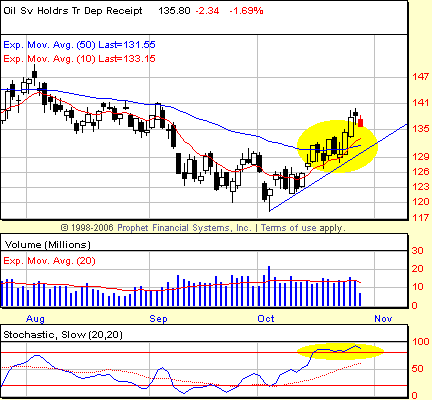
| FIGURE 2: OIL SERVICE HOLDRS, DAILY. Nothing bad ever happens to overbought markets — as long as they remain overbought, that is. An abundance of potential support (two rising moving averages and an uptrend line from the early October lows) suggest that any correction in the month-long rally may be muted. |
| Graphic provided by: Prophet Financial, Inc. |
| |
| It is important to point out that the DI+ crossover has not yet happened in the weekly chart of OIH. DI+/- crosses provide some of the earliest signals of any of the technical tools I look at, so there's no reason to anticipate the crossover. What we can do, however, is change our time frame from the weekly chart to the daily one in order to see what might be the beginning of a significant advance looks like on a day-to-day basis. One of the things I see in the daily chart in Figure 2 is how the OIH has broken out above a trend channel on increased volume just after the stochastic oscillator moved above 80 and into "overbought territory." As far as I'm concerned, one of the great breakthroughs in charting in the past few years is Price Headley's (bigtrends.com) observation that the moment a market becomes overbought is often precisely the time when a trader should become interested in that market (see my Working-Money.com article "BOSO" from October 5, 2005, for more on this concept). What is particularly helpful about this breakthrough is that it not only alerts us to opportunities to enter a market, but it also warns us when the good times have gone. |
| As long as the OIH remains overbought or, failing that, as long as the OIH is able to work off its overbought condition (in order to prepare for another overbought-based move higher) in sideways rather than sharply downward fashion, traders who bought OIH into the support provided by both the 10- and 50-day exponential moving averages as well as the trendline from the October lows are more likely to be rewarded than punished for averaging down -- this time. |
Technical Writer for Technical Analysis of STOCKS & COMMODITIES magazine, Working-Money.com, and Traders.com Advantage.
| Title: | Technical Writer |
| Company: | Technical Analysis, Inc. |
| Address: | 4757 California Avenue SW |
| Seattle, WA 98116 | |
| Phone # for sales: | 206 938 0570 |
| Fax: | 206 938 1307 |
| Website: | www.Traders.com |
| E-mail address: | DPenn@traders.com |
Traders' Resource Links | |
| Charting the Stock Market: The Wyckoff Method -- Books | |
| Working-Money.com -- Online Trading Services | |
| Traders.com Advantage -- Online Trading Services | |
| Technical Analysis of Stocks & Commodities -- Publications and Newsletters | |
| Working Money, at Working-Money.com -- Publications and Newsletters | |
| Traders.com Advantage -- Publications and Newsletters | |
| Professional Traders Starter Kit -- Software | |
Click here for more information about our publications!
Comments
Date: 10/27/06Rank: 3Comment:

Request Information From Our Sponsors
- StockCharts.com, Inc.
- Candle Patterns
- Candlestick Charting Explained
- Intermarket Technical Analysis
- John Murphy on Chart Analysis
- John Murphy's Chart Pattern Recognition
- John Murphy's Market Message
- MurphyExplainsMarketAnalysis-Intermarket Analysis
- MurphyExplainsMarketAnalysis-Visual Analysis
- StockCharts.com
- Technical Analysis of the Financial Markets
- The Visual Investor
- VectorVest, Inc.
- Executive Premier Workshop
- One-Day Options Course
- OptionsPro
- Retirement Income Workshop
- Sure-Fire Trading Systems (VectorVest, Inc.)
- Trading as a Business Workshop
- VectorVest 7 EOD
- VectorVest 7 RealTime/IntraDay
- VectorVest AutoTester
- VectorVest Educational Services
- VectorVest OnLine
- VectorVest Options Analyzer
- VectorVest ProGraphics v6.0
- VectorVest ProTrader 7
- VectorVest RealTime Derby Tool
- VectorVest Simulator
- VectorVest Variator
- VectorVest Watchdog
