

HOT TOPICS LIST
- MACD
- Fibonacci
- RSI
- Gann
- ADXR
- Stochastics
- Volume
- Triangles
- Futures
- Cycles
- Volatility
- ZIGZAG
- MESA
- Retracement
- Aroon
INDICATORS LIST
LIST OF TOPICS
PRINT THIS ARTICLE
by Koos van der Merwe
With OPEC threatening to cut production, is the price of oil on the way up?
Position: Accumulate
Koos van der Merwe
Has been a technical analyst since 1969, and has worked as a futures and options trader with First Financial Futures in Johannesburg, South Africa.
PRINT THIS ARTICLE
DOUBLE BOTTOMS
Is Canwest Petroleum Corp. A Stock To Watch?
10/25/06 03:41:59 PMby Koos van der Merwe
With OPEC threatening to cut production, is the price of oil on the way up?
Position: Accumulate
| Cyclically, November to May are the months when the oil and gas prices in North America reach their highest price levels. This year, however, with El Nino affecting ocean currents in the Pacific, we may experience warmer temperatures, resulting in a warmer than average winter, with less oil and gas used to heat homes, and therefore lower prices. However, with the Organization of Petroleum Exporting Countries (OPEC) threatening to cut production of oil output, prices could rise. However, OPEC is not as effective as it was in the past. The world economy and politicians of the non-OPEC oil producing countries need the income from oil to grow their economies and cannot afford the similar cut in production. In addition, we must not forget about Russia, a wild card country that uses the threat of holding back its oil supply to punish those countries previously part of the USSR that will not toe President Vladimir Putin's line. |
| But — and the but is bigger than you may realize — there are the Canadian oil sands, which are reputed to have more oil than Saudi Arabia. The only problem is that for the Canadian oil sands to be worth accessing, the price of oil must remain high to be economically viable. So with oil prices set to rise, is Canwest Petroleum Corp. a company to look at? Canwest is a public company incorporated in Colorado and, through its subsidiary, Oil Sands Quest Inc., is conducting a major oil sands exploration program in Saskatchewan, Canada. The daily chart (Figure 1) says it all. |
|
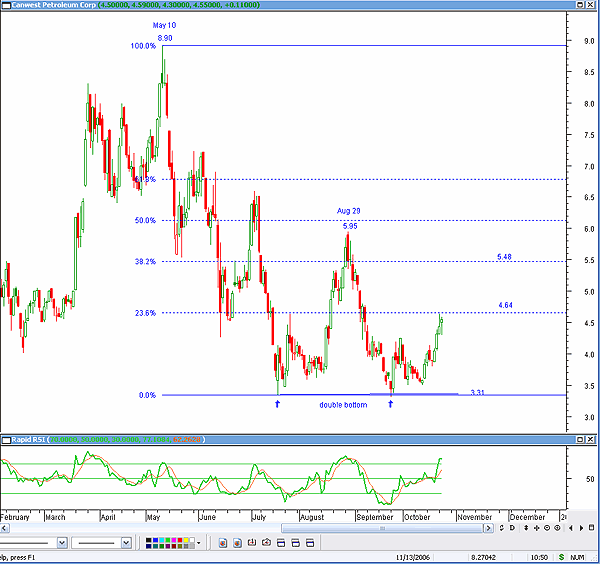
| FIGURE 1: CANWEST PETROLEUM. Canwest Petroleum is showing the double bottom and the rapid RSI is approaching overbought levels. |
| Graphic provided by: MetaStock. |
| |
| The chart shows how the price fell from a high of $8.90 on May 10, 2006, to a low of $3.31 by July. The price then rose to $5.95 and once again fell, forming a very strong double-bottom formation. A Fibonacci retracement from the high of $8.90 to the low of $3.31 is showing a possible resistance level at the 23.6% level. Should it break above this level, its target is the 38.2% level at $5.48, or the high set in August at $5.95. However, the target set by the double bottom is suggesting that the share could rise to $8.59 (5.95 - 3.31 = 2.64 + 5.95 = 8.59). I have used the rapid relative strength index (RSI) recently published in Technical Analysis of STOCKS & COMMODITIES magazine. This indicator is suggesting that the price is overbought at present levels and could correct. See the formula at the end of this article using MetaStock formula language. |
| With winter approaching and with oil and gas prices expected to rise in the months ahead, this is a stock to buy on a correction. |
| Formula for rapid RSI. tp:=14; Plot:=C; change:=ROC(plot,1,$); Z:=Sum(If(change>0,change,0),tp); Y:=Sum(If(change<0,Abs(change),0),tp); Ytemp:=If(y=0,0.0001,y); RS:=Z/Ytemp; 70; 50; 30; RSP:=100-(100/(1+RS)); RSPM:= Mov(RSP , 5, S); RSP; RSPM |
Has been a technical analyst since 1969, and has worked as a futures and options trader with First Financial Futures in Johannesburg, South Africa.
| Address: | 3256 West 24th Ave |
| Vancouver, BC | |
| Phone # for sales: | 6042634214 |
| E-mail address: | petroosp@gmail.com |
Click here for more information about our publications!
Comments
Date:�10/27/06Rank:�3Comment:�
Date:�10/31/06Rank:�5Comment:�

Request Information From Our Sponsors
- StockCharts.com, Inc.
- Candle Patterns
- Candlestick Charting Explained
- Intermarket Technical Analysis
- John Murphy on Chart Analysis
- John Murphy's Chart Pattern Recognition
- John Murphy's Market Message
- MurphyExplainsMarketAnalysis-Intermarket Analysis
- MurphyExplainsMarketAnalysis-Visual Analysis
- StockCharts.com
- Technical Analysis of the Financial Markets
- The Visual Investor
- VectorVest, Inc.
- Executive Premier Workshop
- One-Day Options Course
- OptionsPro
- Retirement Income Workshop
- Sure-Fire Trading Systems (VectorVest, Inc.)
- Trading as a Business Workshop
- VectorVest 7 EOD
- VectorVest 7 RealTime/IntraDay
- VectorVest AutoTester
- VectorVest Educational Services
- VectorVest OnLine
- VectorVest Options Analyzer
- VectorVest ProGraphics v6.0
- VectorVest ProTrader 7
- VectorVest RealTime Derby Tool
- VectorVest Simulator
- VectorVest Variator
- VectorVest Watchdog