HOT TOPICS LIST
- MACD
- Fibonacci
- RSI
- Gann
- ADXR
- Stochastics
- Volume
- Triangles
- Futures
- Cycles
- Volatility
- ZIGZAG
- MESA
- Retracement
- Aroon
INDICATORS LIST
LIST OF TOPICS
PRINT THIS ARTICLE
by David Penn
Breaking out above the 50% retracement level, basic materials stocks show more room to run.
Position: N/A
David Penn
Technical Writer for Technical Analysis of STOCKS & COMMODITIES magazine, Working-Money.com, and Traders.com Advantage.
PRINT THIS ARTICLE
FIBONACCI
Basic Materials? Come On Down!
10/25/06 03:06:52 PMby David Penn
Breaking out above the 50% retracement level, basic materials stocks show more room to run.
Position: N/A
| Every dog has its day, or so goes the saying. And that apparently includes such dogged stocks as those belonging to the basic materials group. |

|
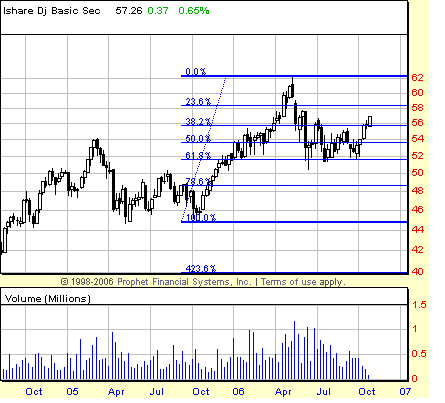
| FIGURE 1: DOW JONES BASIC MATERIALS SECTOR iSHARE, WEEKLY. After rallying nearly 35% from its bottom in October 2005, shares of IYM slipped into a correction that retraced a Fibonacci 61.8% before forming what appears to be a bottom. |
| Graphic provided by: Prophet Financial, Inc. |
| |
| For much of 2006, the basic materials sector was the sector to own. Basic materials includes everything from gold and silver to aluminum, copper, oil and steel, and you probably don't even need to look at a chart to recall how well most of these commodities have done — and particularly since the October 2005 bottom. After topping in early May, basic materials stocks plunged into a correction that saw them retrace (basis IYM, the basic materials exchange traded fund) fully 61.8% of their rally from October 2005. See Figure 1. |
| But along with apparently every other sector in the market, basic materials have started to make a real comeback in the early autumn. Whether these stocks will move on to new highs in 2006 or early 2007 remains to be seen. But it is increasingly likely that a test of those May 2006 highs will come sooner rather than later. The support IYM appeared to find at the 52 level — a level that corresponds with the lows from the first quarter of 2006 — looks all the more solid for the amount of time the exchange traded fund spent testing it. And the decline in volume as the consolidation developed from late spring to late summer is also typical of what a technician would expect to find as a consolidation matured and moved closer to breakout. |

|
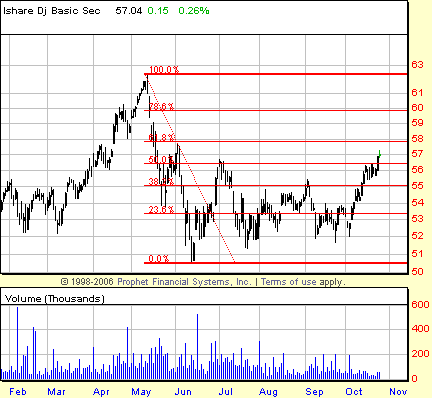
| FIGURE 2: DOW JONES BASIC MATERIALS SECTOR iSHARE, DAILY. The width of the five-month base in basic materials stocks suggests that the October breakout could take IYM to as high as 60. |
| Graphic provided by: Prophet Financial, Inc. |
| |
| Looking at the daily chart (Figure 2), we can see another instance of a Fibonacci level playing a role in helping assess price action. Here, we note that IYM has managed to bounce back above the 50% retracement level for a second time — the first time coming in the wake of the low made in June. The first effort to remain above that 50% retracement failed, yet the correction that followed did not set a new low. Instead, IYM entered a trading range bound by both the failed attempt to take out the 50% retracement level on the upside and the higher low in July on the downside. This in and of itself was a promising event for the bulls, suggesting that as long as the pattern of higher lows held, there was an increasing likelihood that the more enduring move would be higher. |
| And higher is just what basic materials bulls got as still higher lows in the autumn (relative to the summer lows) marked a bottom from which IYM rallied strongly over the course of October. In almost a straight line, IYM soared from an October low near 52 to over 57 late in the month. This move marks the second time IYM has bested the 50% retracement level from the May 2006 top, and while volume has picked up, it will still probably take a much stronger show of conviction before the bulls find the sort of buying company they need to power IYM significantly higher than it already is. As far as upside targets go, the width of the consolidation (conservatively, four points) suggest that an upside move to the 60 is the most likely apple in the eyes of those buying IYM now. |
Technical Writer for Technical Analysis of STOCKS & COMMODITIES magazine, Working-Money.com, and Traders.com Advantage.
| Title: | Technical Writer |
| Company: | Technical Analysis, Inc. |
| Address: | 4757 California Avenue SW |
| Seattle, WA 98116 | |
| Phone # for sales: | 206 938 0570 |
| Fax: | 206 938 1307 |
| Website: | www.Traders.com |
| E-mail address: | DPenn@traders.com |
Traders' Resource Links | |
| Charting the Stock Market: The Wyckoff Method -- Books | |
| Working-Money.com -- Online Trading Services | |
| Traders.com Advantage -- Online Trading Services | |
| Technical Analysis of Stocks & Commodities -- Publications and Newsletters | |
| Working Money, at Working-Money.com -- Publications and Newsletters | |
| Traders.com Advantage -- Publications and Newsletters | |
| Professional Traders Starter Kit -- Software | |
Click here for more information about our publications!
Comments
Date: 10/25/06Rank: 3Comment:

Request Information From Our Sponsors
- StockCharts.com, Inc.
- Candle Patterns
- Candlestick Charting Explained
- Intermarket Technical Analysis
- John Murphy on Chart Analysis
- John Murphy's Chart Pattern Recognition
- John Murphy's Market Message
- MurphyExplainsMarketAnalysis-Intermarket Analysis
- MurphyExplainsMarketAnalysis-Visual Analysis
- StockCharts.com
- Technical Analysis of the Financial Markets
- The Visual Investor
- VectorVest, Inc.
- Executive Premier Workshop
- One-Day Options Course
- OptionsPro
- Retirement Income Workshop
- Sure-Fire Trading Systems (VectorVest, Inc.)
- Trading as a Business Workshop
- VectorVest 7 EOD
- VectorVest 7 RealTime/IntraDay
- VectorVest AutoTester
- VectorVest Educational Services
- VectorVest OnLine
- VectorVest Options Analyzer
- VectorVest ProGraphics v6.0
- VectorVest ProTrader 7
- VectorVest RealTime Derby Tool
- VectorVest Simulator
- VectorVest Variator
- VectorVest Watchdog
