HOT TOPICS LIST
- MACD
- Fibonacci
- RSI
- Gann
- ADXR
- Stochastics
- Volume
- Triangles
- Futures
- Cycles
- Volatility
- ZIGZAG
- MESA
- Retracement
- Aroon
INDICATORS LIST
LIST OF TOPICS
PRINT THIS ARTICLE
by David Penn
Another method of determining when a bounce in a downtrend may have run its course is the short-term 2B top.
Position: N/A
David Penn
Technical Writer for Technical Analysis of STOCKS & COMMODITIES magazine, Working-Money.com, and Traders.com Advantage.
PRINT THIS ARTICLE
REVERSAL
2B Tops In Downtrends
10/25/06 08:39:06 AMby David Penn
Another method of determining when a bounce in a downtrend may have run its course is the short-term 2B top.
Position: N/A
Some of the best advice I ever read about shorting stocks came from Gary Smith, formerly one of the top technical analysts at TheStreet.com. His attitude was that a good short candidate must feature a "major downside break." And what did he mean by "major"? On a chart, the break should look ugly. If it made a sound, it'd be like a bad broken leg. |

|
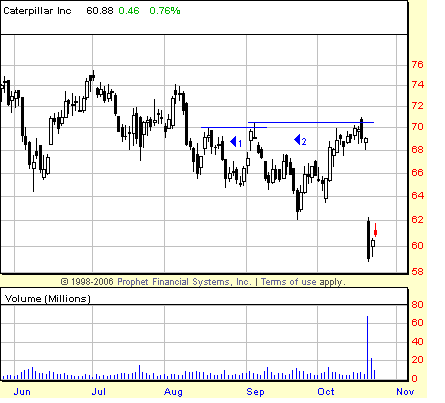
| FIGURE 1: CATERPILLAR, DAILY. Both short-term 2B tops provided traders with an opportunity to make a pro-trend, bearish bet just as the market was showing some signs of strength. By going short at the low of the session that noted the initial high, traders in September and again in October made quick profits. |
| Graphic provided by: Prophet Financial, Inc. |
| |
| For better or worse, many traders don't want to wait for the leg to break before they start betting against it. Looking to maximize risk/reward, many traders look to short tops instead. Obviously, this is a risky business insofar as markets that are making tops are by definition displaying at least short-term strength. But there are various methods -- from betting against stocks at resistance to using candlestick patterns and negative divergences -- that traders have effectively used to game such short-term strength and, ultimately, wager against it lasting. |
| The 2B test is one of those methods. At root, the 2B test suggests that when a market makes a high and then, after a pullback, makes a higher high but fails to follow through to the upside, it is often the case that a reversal in trend is in the offing. While this method is effective after long rallies, it is also effective -- perhaps more so -- at spotting potential tops in downtrends, when rallies are most suspect. The chart of Caterpillar in Figure 1 provides an example of two such 2B tests of top taking place during an overall downtrend that began when the stock topped in May. |

|
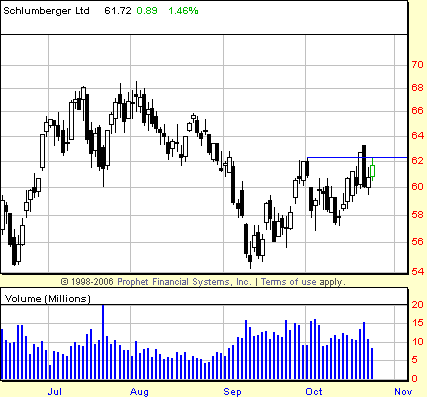
| FIGURE 2: SCHLUMBERGER, DAILY. A possible 2B top sets up in this stock, which topped out in May. If the bottom was reached in September, then SLB will need to show more strength by closing and remaining above the October highs near 63. |
| Graphic provided by: Prophet Financial, Inc. |
| |
| The first 2B in the second half of August was very short term, but profitable nonetheless. During a bounce in a downtrend, CAT made a minor high on August 17, then a somewhat higher high on September 6. When on the next day, September 7, shares of CAT did not follow through but instead slipped down below the low of August 17, a 2B sell was triggered as the August 17 low was taken out (at approximately 68.75). Three days later, CAT closed at 65.15 -- a little more than a point a day. Interestingly, the second higher high in early September turned out to be the initial high in a later, somewhat larger 2B top over the course of September and October. With this larger 2B we have our initial high on September 6 and then, after a decline and a rally, a higher high on October 18. It is worth pointing out that the higher high on October 18 came in the form of a bearish engulfing candlestick. |
| So again: Will there be follow-through? Unsurprisingly, given the bearish engulfing candlestick, there was no follow-through to the upside and instead, CAT slipped a little lower the next day. Because the low of the engulfing session was lower than the lower of the previous high back on September 6, traders could have used the low of the October 18th session as their "line in the sand": if breached, then time to go short. Even a more conservative trader who waited to sell CAT at a lower level would have been well rewarded. The aggressive trader may have got a fill on a short at, say, 68.50, but even the conservative trader would have likely gotten short at 62 and, by the end of the session, be up some three-odd points. Obviously, the aggressive trader would have done better, but the fact of the matter is that both approaches allowed the trader to make low risk/high reward bets using the 2B setup. Another example of the 2B top can be seen in Figure 2. |
Technical Writer for Technical Analysis of STOCKS & COMMODITIES magazine, Working-Money.com, and Traders.com Advantage.
| Title: | Technical Writer |
| Company: | Technical Analysis, Inc. |
| Address: | 4757 California Avenue SW |
| Seattle, WA 98116 | |
| Phone # for sales: | 206 938 0570 |
| Fax: | 206 938 1307 |
| Website: | www.Traders.com |
| E-mail address: | DPenn@traders.com |
Traders' Resource Links | |
| Charting the Stock Market: The Wyckoff Method -- Books | |
| Working-Money.com -- Online Trading Services | |
| Traders.com Advantage -- Online Trading Services | |
| Technical Analysis of Stocks & Commodities -- Publications and Newsletters | |
| Working Money, at Working-Money.com -- Publications and Newsletters | |
| Traders.com Advantage -- Publications and Newsletters | |
| Professional Traders Starter Kit -- Software | |
Click here for more information about our publications!
Comments
Date: 10/25/06Rank: 3Comment:

Request Information From Our Sponsors
- VectorVest, Inc.
- Executive Premier Workshop
- One-Day Options Course
- OptionsPro
- Retirement Income Workshop
- Sure-Fire Trading Systems (VectorVest, Inc.)
- Trading as a Business Workshop
- VectorVest 7 EOD
- VectorVest 7 RealTime/IntraDay
- VectorVest AutoTester
- VectorVest Educational Services
- VectorVest OnLine
- VectorVest Options Analyzer
- VectorVest ProGraphics v6.0
- VectorVest ProTrader 7
- VectorVest RealTime Derby Tool
- VectorVest Simulator
- VectorVest Variator
- VectorVest Watchdog
- StockCharts.com, Inc.
- Candle Patterns
- Candlestick Charting Explained
- Intermarket Technical Analysis
- John Murphy on Chart Analysis
- John Murphy's Chart Pattern Recognition
- John Murphy's Market Message
- MurphyExplainsMarketAnalysis-Intermarket Analysis
- MurphyExplainsMarketAnalysis-Visual Analysis
- StockCharts.com
- Technical Analysis of the Financial Markets
- The Visual Investor
