

HOT TOPICS LIST
- MACD
- Fibonacci
- RSI
- Gann
- ADXR
- Stochastics
- Volume
- Triangles
- Futures
- Cycles
- Volatility
- ZIGZAG
- MESA
- Retracement
- Aroon
INDICATORS LIST
LIST OF TOPICS
PRINT THIS ARTICLE
by David Penn
Positive directional movement in the daily chart of energy stocks suggests more bounce for energies.
Position: N/A
David Penn
Technical Writer for Technical Analysis of STOCKS & COMMODITIES magazine, Working-Money.com, and Traders.com Advantage.
PRINT THIS ARTICLE
SECTOR INVESTING
Are Energy Stocks Powering Up?
10/24/06 10:14:35 AMby David Penn
Positive directional movement in the daily chart of energy stocks suggests more bounce for energies.
Position: N/A
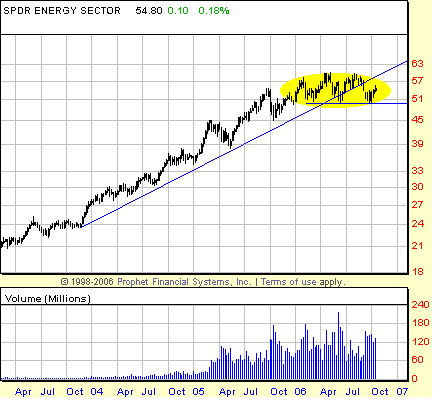
| If energy stocks are in a bear market, there must be plenty of bear market to go. That much is plain from even a casual glance at the three-year chart of XLE, the energy sector SPDRS seen in Figure 1. While the exchange traded fund shows a clear breakdown below its longer-term trendline in the early summer and again in the autumn, critical support at about the 50 level continues to hold. |
|
| FIGURE 1: ENERGY SECTOR SPDRS, WEEKLY. Long-term trendline breaks in the summer and autumn of 2006 help reinforce a potential source of support near the 50 price area. The trendline that had provided support since late 2003 now functions as resistance in the event of an attempt at a new high. |
| Graphic provided by: Prophet Financial, Inc. |
| |
| In many respects, the top in the XLE that developed over the course of 2006 looks more like a consolidation in the head & shoulders top drag. More than a few energy bears were looking at the possibility of the rise and fall of energy stocks in the third quarter (July–September) being the completion of a right shoulder to a topping pattern that anticipated a minimum fall to the 42 level. Such a correction may still occur. But for the time being, support has held and the next question is: How high will the energy plays bounce? |
| On the weekly chart, then, I am watching for the resolution of this 1-2-3 trendline reversal. Per that methodology, XLE is in stage 2; the initial trendline break is stage 1 and the final breakdown beneath the lows established by the initial trendline break in stage 1 is stage 3. Stage 2 of the 1-2-3 trendline reversal represents the effort by the market in question to reassert the pre-break trend. In the case of XLE's trendline break in 2006, that effort will be to set a new closing high north of 60 — preferably on significantly above average volume. |
|
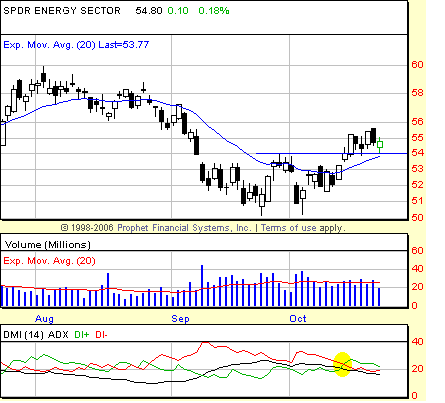
| FIGURE 2: ENERGY SECTOR SPDRS, DAILY. A crossover of the bearish DI- line (in red) by the bullish DI+ line (in green) is often an early sign of a trend reversing to the upside. This is all the more likely to be the case when the ADX (in black) is both lower than 20 and lower than both the DI- and DI+ lines. |
| Graphic provided by: Prophet Financial, Inc. |
| |
| As the daily chart in Figure 2 shows, there is a sizable amount of resistance between 56 and 60 — the August consolidation — that bulls will have to fight their way through en route to those new highs. However, the indicators — as well as recent price movement — are suggesting that XLE might have the buyers to do it. Note first that XLE has rallied above short-term resistance at 54. The move was a gap up, which is relatively impressive even if not accompanied by the sort of overwhelming volume that would truly confirm a powerful breakout. The move higher appears to be a breakout from a short-term double bottom from early September to mid-October. That double bottom suggests a minimum upside to the 58 area or so. The XLE now also has the 20-day exponential moving average (EMA) beneath it rather than above it, potentially creating another source of support (the first being the breakout level at 54). |
| Adding to these intimations of bullishness for energy stocks is the bullish crossover in the directional movement index. Note how in mid-October the bullish DI+ line (in green) has crossed over the bearish DI- line (in red). This is a classic buy signal using J. Welles Wilder's directional movement trading methodology. Specifically, Wilder's method would issue a buy signal, once the high of the session during which the crossover occurred (here October 13) was exceeded. That high was 54.39 and it was exceeded on the following day. Less-aggressive traders may prefer to wait for a confirming signal in the form of an average directional movement index (ADX) (in black) also crossing over the bearish DI- line, which also seems likely in the near term. |
Technical Writer for Technical Analysis of STOCKS & COMMODITIES magazine, Working-Money.com, and Traders.com Advantage.
| Title: | Technical Writer |
| Company: | Technical Analysis, Inc. |
| Address: | 4757 California Avenue SW |
| Seattle, WA 98116 | |
| Phone # for sales: | 206 938 0570 |
| Fax: | 206 938 1307 |
| Website: | www.Traders.com |
| E-mail address: | DPenn@traders.com |
Traders' Resource Links | |
| Charting the Stock Market: The Wyckoff Method -- Books | |
| Working-Money.com -- Online Trading Services | |
| Traders.com Advantage -- Online Trading Services | |
| Technical Analysis of Stocks & Commodities -- Publications and Newsletters | |
| Working Money, at Working-Money.com -- Publications and Newsletters | |
| Traders.com Advantage -- Publications and Newsletters | |
| Professional Traders Starter Kit -- Software | |
Click here for more information about our publications!
Comments
Date:�10/24/06Rank:�3Comment:�

Request Information From Our Sponsors
- StockCharts.com, Inc.
- Candle Patterns
- Candlestick Charting Explained
- Intermarket Technical Analysis
- John Murphy on Chart Analysis
- John Murphy's Chart Pattern Recognition
- John Murphy's Market Message
- MurphyExplainsMarketAnalysis-Intermarket Analysis
- MurphyExplainsMarketAnalysis-Visual Analysis
- StockCharts.com
- Technical Analysis of the Financial Markets
- The Visual Investor
- VectorVest, Inc.
- Executive Premier Workshop
- One-Day Options Course
- OptionsPro
- Retirement Income Workshop
- Sure-Fire Trading Systems (VectorVest, Inc.)
- Trading as a Business Workshop
- VectorVest 7 EOD
- VectorVest 7 RealTime/IntraDay
- VectorVest AutoTester
- VectorVest Educational Services
- VectorVest OnLine
- VectorVest Options Analyzer
- VectorVest ProGraphics v6.0
- VectorVest ProTrader 7
- VectorVest RealTime Derby Tool
- VectorVest Simulator
- VectorVest Variator
- VectorVest Watchdog