HOT TOPICS LIST
- MACD
- Fibonacci
- RSI
- Gann
- ADXR
- Stochastics
- Volume
- Triangles
- Futures
- Cycles
- Volatility
- ZIGZAG
- MESA
- Retracement
- Aroon
INDICATORS LIST
LIST OF TOPICS
PRINT THIS ARTICLE
by Paolo Pezzutti
The airline stock is tagging the upper trendline of a broadening formation, and volatility is increasing.
Position: N/A
Paolo Pezzutti
Author of the book "Trading the US Markets - A Comprehensive Guide to US Markets for International Traders and Investors" - Harriman House (July 2008)
PRINT THIS ARTICLE
BROADENING FORMATION
Continental Airlines Prints A Broadening Formation
10/24/06 09:49:36 AMby Paolo Pezzutti
The airline stock is tagging the upper trendline of a broadening formation, and volatility is increasing.
Position: N/A
| Continental Airlines Inc. (CAL) reported the third-quarter 2006 net income of $237 million compared to $61 million in the third quarter of 2005. Passenger revenue for the quarter increased 17.1% over the same period in 2005 to $3.2 billion. The good earnings report fueled the stock, which jumped more than 7% on Friday. Moreover, Fitch on Friday upgraded debt ratings for CAL to "B-" from "CCC" and gave Continental a stable rating outlook. According to Fitch, Continental is in a good position to fund 2007 obligations without pressuring its cash position significantly. |

|
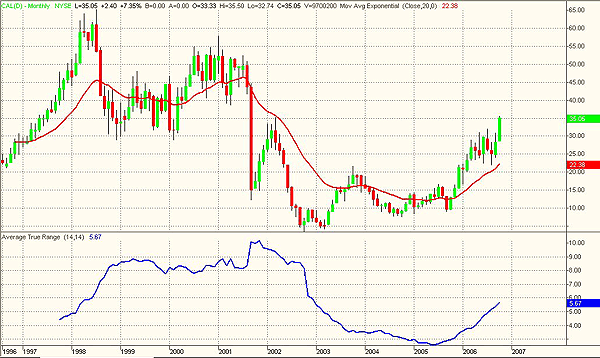
| FIGURE 1: CONTINENTAL AIRLINES, MONTHLY. During the past four years, the stock has developed an uptrend, moving from the $3.59 level to the present $35. |
| Graphic provided by: TradeStation. |
| |
| The long-term chart (Figure 1) indicates that the stock printed its all-time high back in 1998 at about $65. The September 2001 saw prices plunge to the $15 level and even lower lows in October 2002 at $3.60. During the past four years Continental has developed an uptrend to reach the current value of $35. The impressive recovery process of the stock has occurred together with the exponential rise of oil prices, which has helped the company produce profits. In this time frame, volatility is increasing together with momentum and directionality, indicating that prices should continue to move to the upside in the coming months, unless something new emerges on the fundamentals side. |

|
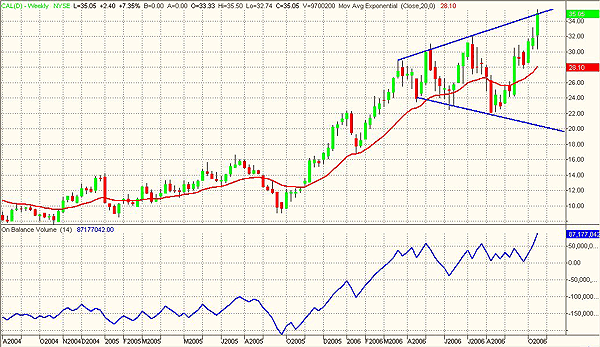
| FIGURE 2, CONTINENTAL AIRLINES, WEEKLY. TheOBV Indicator is printing new highs, indicating that the stock is being accumulated by investors. |
| Graphic provided by: TradeStation. |
| |
| In the weekly chart (Figure 2), you can see that the stock has been bought aggressively during the past year. The on-balance volume (OBV) is used to find confirmation about the strength of the ongoing price action. When prices close lower today than they did yesterday, then the volume of that is considered down volume and is assigned a negative value. When prices close higher today than they closed yesterday, then the volume of that day is considered up volume and is assigned a positive value. The indicator is, basically, a simple running total of down volume and up volume. It may help the investor to understand if it is clear that investors are accumulating or dumping a stock during the various phases of a trend. The OBV is confirming the stock's new highs, printing its highest value since 1997, indicating the uptrend is healthy. Since last April, it has been moving sideways in coincidence with the ongoing consolidation phase. |

|
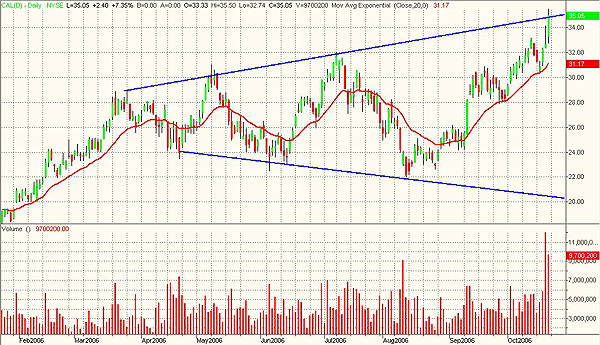
| FIGURE 3: CONTINENTAL AIRLINES, DAILY. The stock is tagging the upper trendline of a broadening formation. Risk is getting higher at this level of price. |
| Graphic provided by: TradeStation. |
| |
| At the daily level (Figure 3), you can see the nice broadening formation developed during the past six months. I described this pattern in my September 18th article in Traders.com Advantage. The broadening formation is a rare variation of a triangle characterized by diverging trendlines. It is formed by price swings that are increasingly widening. Volume usually expands along with the wider price swings in a volatile market. The interesting point is that it appears often at major tops. You can see that prices have touched each trendline at least two times and swung in a progressively wider range with higher highs and lower lows. Friday's extension to the upside brought prices to tag the upper trendline with heavy volume. It came at the end of the leg started last August with a low of $22. Compared to the present $35, it is quite impressive. |
| Far from saying that the trend is over and this is a top, my opinion is that buying this level has a high risk compared to the potential reward. The overall market trend is well defined, stable, and strong. Trying to fade the market during these phases can be very painful. In fact, it is difficult to understand when the public's fresh money is going to be exhausted. Emotional phases can last a long time. Prices can continue to go up despite multiple divergences of various indicators until you have a sudden and fast reversal. If you are already in the market, the best thing to do is trail your stop following the growing prices. If you are still interested in buying, it is not easy to enter the market at new highs after a four-month up leg. At least you should find low-risk ponts where you can control your potential losses. |
Author of the book "Trading the US Markets - A Comprehensive Guide to US Markets for International Traders and Investors" - Harriman House (July 2008)
| Address: | VIA ROBERTO AGO 26 POSTAL CODE 00166 |
| Rome, ITALY | |
| Phone # for sales: | +393357540708 |
| E-mail address: | pezzutti.paolo@tiscali.it |
Click here for more information about our publications!
Comments
Date: 10/24/06Rank: 4Comment:

Request Information From Our Sponsors
- StockCharts.com, Inc.
- Candle Patterns
- Candlestick Charting Explained
- Intermarket Technical Analysis
- John Murphy on Chart Analysis
- John Murphy's Chart Pattern Recognition
- John Murphy's Market Message
- MurphyExplainsMarketAnalysis-Intermarket Analysis
- MurphyExplainsMarketAnalysis-Visual Analysis
- StockCharts.com
- Technical Analysis of the Financial Markets
- The Visual Investor
- VectorVest, Inc.
- Executive Premier Workshop
- One-Day Options Course
- OptionsPro
- Retirement Income Workshop
- Sure-Fire Trading Systems (VectorVest, Inc.)
- Trading as a Business Workshop
- VectorVest 7 EOD
- VectorVest 7 RealTime/IntraDay
- VectorVest AutoTester
- VectorVest Educational Services
- VectorVest OnLine
- VectorVest Options Analyzer
- VectorVest ProGraphics v6.0
- VectorVest ProTrader 7
- VectorVest RealTime Derby Tool
- VectorVest Simulator
- VectorVest Variator
- VectorVest Watchdog
