HOT TOPICS LIST
- MACD
- Fibonacci
- RSI
- Gann
- ADXR
- Stochastics
- Volume
- Triangles
- Futures
- Cycles
- Volatility
- ZIGZAG
- MESA
- Retracement
- Aroon
INDICATORS LIST
LIST OF TOPICS
PRINT THIS ARTICLE
by David Penn
Weekly charts suggest that biotech stocks may have finally made their move higher.
Position: N/A
David Penn
Technical Writer for Technical Analysis of STOCKS & COMMODITIES magazine, Working-Money.com, and Traders.com Advantage.
PRINT THIS ARTICLE
BREAKOUTS
Biotech Breakout
10/23/06 01:17:22 PMby David Penn
Weekly charts suggest that biotech stocks may have finally made their move higher.
Position: N/A
| According to the 2006 edition of The Stock Traders' Almanac, there are three market sectors that tend to bottom in the summer and rally into the autumn, if not beyond. The first, the shortest move allegedly, can be found in the gold and silver stocks, which have a historical tendency to rally from July to September. The second group to move is the utilities stocks, which have shown a tendency to rally from July to January. The third group? The biotechs. |

|
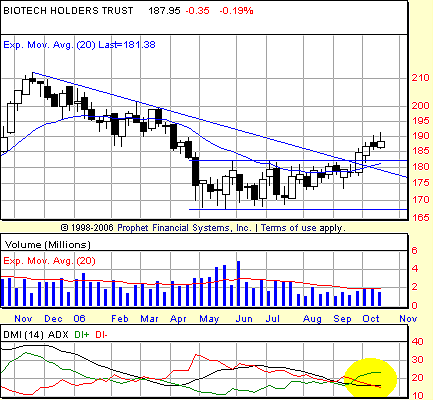
| FIGURE 1: BIOTECH HOLDRS, WEEKLY. A DI+ (in green) cross above the DI- (in red) develops as the biotechnology HOLDRS breaks out above a multimonth downtrend line, resistance in the form of the 20-week exponential moving average and the upper limit of a trading range that has been in place since May. |
| Graphic provided by: Prophet Financial, Inc. |
| |
| As such, I've written a few times about biotech stocks this year. Although I took a longer-term look at the group ("Betting On Biotech," June 13, 2006; Working-Money.com) in expectation of those historical trends toward a mid-summer low, more recently I considered the bearish argument for biotechs ("Waving The Biotechs," September 5, 2006; Traders.com Advantage). That argument was predicated on whether the BBH would be able to break through the resistance of both its own multimonth trading range as well as the downtrend line from the November 2005 highs (Figure 1). |
| Other sectors have made far more impressive moves in the second half of the summer and into the autumn. But it is hard to deny the perception that biotechnology stocks have been quiet gainers. In fact, per the forementioned almanac we noted that biotech stocks began making higher weekly lows in July and, moving into October, have failed to make a single successive, lower weekly low. Trends like this can be important as consolidations mature toward a breakout. Because consistently higher highs or lower lows can be difficult to come by when a consolidating market remains under significant selling or buying pressure, respectively, sometimes clues can be found in the other side of the equation. By that, if you can't find higher highs to confirm a bullish bias, try looking for consistently higher lows. Similarly, if you don't see a pattern of lower lows in a market you believe is hiding a bearish bias, try looking for consistently lower highs. |

|
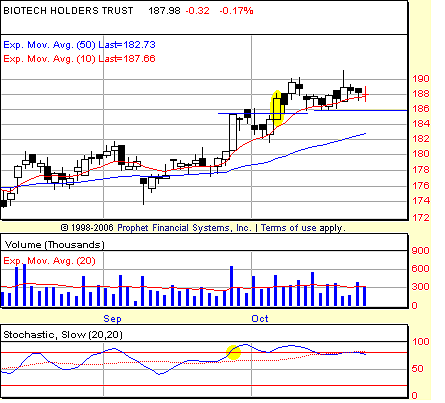
| FIGURE 2: BIOTECH HOLDRS, DAILY. A BOSO buy signal (highlighted oval in stochastic) in late September is triggered in early October (highlighted candlestick in chart), with both sessions coming in on above-average volume. The consolidation intraday low just south of 186 is the most immediate exit point. |
| Graphic provided by: Prophet Financial, Inc. |
| |
| In Figure 2, I've attached a daily trading snapshot of the BBH using the BOSO screen, an analytic approach derived from the work of Price Headley (bigtrends.com) that successfully seeks profit opportunities in the overbought and oversold markets where few traders dare to tread. Other screens and setups would have likely called for the same sort of entry, heralded by a surge in volume on a wide-ranging day in late September and a confirming volume surge six sessions later. |
| What is most promising about the potential for more upside is the current consolidation in October. Many stocks moved up quickly from the mid- to late summer lows; many retailing stocks fell into this category, making them often too hot for many investors to handle. The biotech stocks, should they continue higher, have shown few signs of the rush-to-buy impulse that keep more cautious investors away. Could the revenue-rich, profit-poor biotechs — the very emblem of market speculation over the years — turn out to be a safer ride higher than its more equity-conscious comrades from the strip malls and discount outlets? |
Technical Writer for Technical Analysis of STOCKS & COMMODITIES magazine, Working-Money.com, and Traders.com Advantage.
| Title: | Technical Writer |
| Company: | Technical Analysis, Inc. |
| Address: | 4757 California Avenue SW |
| Seattle, WA 98116 | |
| Phone # for sales: | 206 938 0570 |
| Fax: | 206 938 1307 |
| Website: | www.Traders.com |
| E-mail address: | DPenn@traders.com |
Traders' Resource Links | |
| Charting the Stock Market: The Wyckoff Method -- Books | |
| Working-Money.com -- Online Trading Services | |
| Traders.com Advantage -- Online Trading Services | |
| Technical Analysis of Stocks & Commodities -- Publications and Newsletters | |
| Working Money, at Working-Money.com -- Publications and Newsletters | |
| Traders.com Advantage -- Publications and Newsletters | |
| Professional Traders Starter Kit -- Software | |
Click here for more information about our publications!
Comments
Date: 10/24/06Rank: 3Comment:

Request Information From Our Sponsors
- StockCharts.com, Inc.
- Candle Patterns
- Candlestick Charting Explained
- Intermarket Technical Analysis
- John Murphy on Chart Analysis
- John Murphy's Chart Pattern Recognition
- John Murphy's Market Message
- MurphyExplainsMarketAnalysis-Intermarket Analysis
- MurphyExplainsMarketAnalysis-Visual Analysis
- StockCharts.com
- Technical Analysis of the Financial Markets
- The Visual Investor
- VectorVest, Inc.
- Executive Premier Workshop
- One-Day Options Course
- OptionsPro
- Retirement Income Workshop
- Sure-Fire Trading Systems (VectorVest, Inc.)
- Trading as a Business Workshop
- VectorVest 7 EOD
- VectorVest 7 RealTime/IntraDay
- VectorVest AutoTester
- VectorVest Educational Services
- VectorVest OnLine
- VectorVest Options Analyzer
- VectorVest ProGraphics v6.0
- VectorVest ProTrader 7
- VectorVest RealTime Derby Tool
- VectorVest Simulator
- VectorVest Variator
- VectorVest Watchdog
