HOT TOPICS LIST
- MACD
- Fibonacci
- RSI
- Gann
- ADXR
- Stochastics
- Volume
- Triangles
- Futures
- Cycles
- Volatility
- ZIGZAG
- MESA
- Retracement
- Aroon
INDICATORS LIST
LIST OF TOPICS
PRINT THIS ARTICLE
by David Penn
Think you missed your moment? Try changing your time frame.
Position: N/A
David Penn
Technical Writer for Technical Analysis of STOCKS & COMMODITIES magazine, Working-Money.com, and Traders.com Advantage.
PRINT THIS ARTICLE
TECHNICAL ANALYSIS
Weeklies And Dailies: A Tale Of Two Charts
10/20/06 09:49:14 AMby David Penn
Think you missed your moment? Try changing your time frame.
Position: N/A
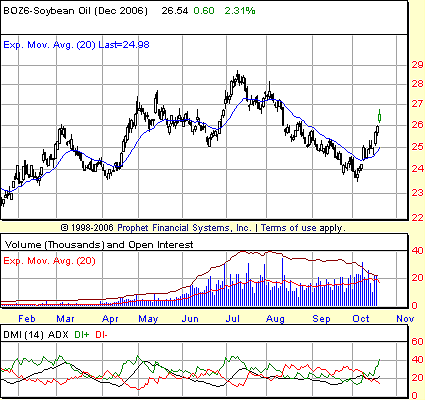
| How many times have you heard the admonishment against "chasing" markets? I myself got into trouble weeks ago trying to "chase" the breakdown in Halliburton. Although the mistake — going short days after a short signal had been issued by one of my methods — didn't cost me a great deal in money terms, it was nonetheless a terrible error in judgment that will continue to impede my efforts to trade better and more efficiently if I don't avoid that mistake in the future. The graybeards of the trading world also warn us against switching time frames once a trade has been established. Usually, this is expressed as "don't turn a trade into an investment." Here the problem is that a trade goes wrong and the trader, fearful of admitting the mistake, decides to change the time frame of his expectations to believe that what should have happened in a matter of days (that is, now that it isn't happening in a matter of days) should really happen in a matter of weeks. Or months. Or years. You can imagine the ruin to which this kind of path will lead. But switching time frames during the analysis phase of a trade can definitely pay off — in fact, it can be the primary guide to determining whether you are putting on a trade or an investment in the first place. It can also let you know if an opportunity in the market has truly passed you by. For example, take a look at the daily chart of December soybean oil in Figure 1. |

|
| FIGURE 1: DECEMBER SOYBEAN OIL, DAILY. Breaking out above the resistance of the 20-day EMA on outsized volume, BOZ6 begins a near-vertical ascent in October. |
| Graphic provided by: Prophet Financial, Inc. |
| |
| On the daily chart, soybeans (BOZ6) looks like a classic example of the one that got away. In hindsight, a trader looking at this chart spots the volume surge on the day BOZ6 broke above the 20-day exponential moving average (EMA) as the key day to get long the contract. Bean oil pays $600 a cent, so an entry at 25 cents would be looking pretty swell right about now. That volume surge day also arrived one day before the bullish DI+ line (in green) crossed over the bearish DI- line (in red). |
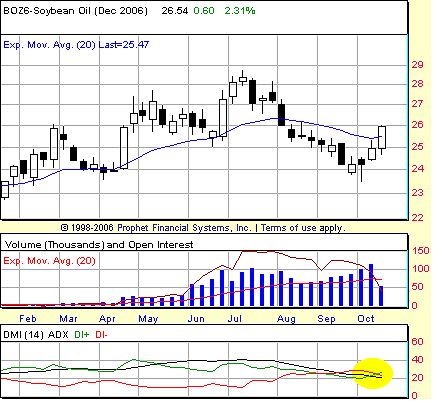
| But look at how overextended bean oil is! It's moving straight up! And it doesn't take x-ray vision to see the potential for resistance at the 27-cent level — a level it appears that bean bulls have (at least initially) pulled back from. On the other hand, a different view suggests that the good times for bean bulls may be just beginning. Consider how December soybean oil looks over the same period of time, but through the lens of a weekly price chart. |

|
| FIGURE 2: DECEMBER SOYBEAN OIL, WEEKLY. Compared to the daily chart, the weekly chart of BOZ6 makes it look as if the bullish party has hardly started. The crossover of the bullish DI+ line has barely begun and the average directional movement index (ADX)(in black) has slipped below 20, indicating a lack of trend as the commodity appears to bottom in early October. |
| Graphic provided by: Prophet Financial, Inc. |
| |
| On the weekly chart (Figure 2), the breakout above the 20-period EMA is just happening. In fact, as of this writing (Thursday, October 19), there's a chance that a reversal on Friday, October 20, could negate what appears to be bean oil's first weekly close above the 20-period EMA since shortly after the top in July. Note also how the bullish DI+ line is just crossing the bearish DI- line. This means that the next print above the high of this most recent week (the week beginning October 16) will trigger a buy signal based on directional movement guru J. Welles Wilder's extreme point theory (see my Working-Money.com article "Trading DI+/-" from October 12 for more on this). |
| What is interesting is that while the commodity appears overextended on the daily chart, it appears to be still just a contender — albeit a promising one — on the weekly chart. As such, I wouldn't be surprised to see a pullback over the next week or so as short-term excesses are worked off and longer-term buying pressure has more of a chance to gather. |
Technical Writer for Technical Analysis of STOCKS & COMMODITIES magazine, Working-Money.com, and Traders.com Advantage.
| Title: | Technical Writer |
| Company: | Technical Analysis, Inc. |
| Address: | 4757 California Avenue SW |
| Seattle, WA 98116 | |
| Phone # for sales: | 206 938 0570 |
| Fax: | 206 938 1307 |
| Website: | www.Traders.com |
| E-mail address: | DPenn@traders.com |
Traders' Resource Links | |
| Charting the Stock Market: The Wyckoff Method -- Books | |
| Working-Money.com -- Online Trading Services | |
| Traders.com Advantage -- Online Trading Services | |
| Technical Analysis of Stocks & Commodities -- Publications and Newsletters | |
| Working Money, at Working-Money.com -- Publications and Newsletters | |
| Traders.com Advantage -- Publications and Newsletters | |
| Professional Traders Starter Kit -- Software | |
Click here for more information about our publications!
Comments
Date: 10/20/06Rank: 3Comment:
Date: 10/26/06Rank: 3Comment:

Request Information From Our Sponsors
- StockCharts.com, Inc.
- Candle Patterns
- Candlestick Charting Explained
- Intermarket Technical Analysis
- John Murphy on Chart Analysis
- John Murphy's Chart Pattern Recognition
- John Murphy's Market Message
- MurphyExplainsMarketAnalysis-Intermarket Analysis
- MurphyExplainsMarketAnalysis-Visual Analysis
- StockCharts.com
- Technical Analysis of the Financial Markets
- The Visual Investor
- VectorVest, Inc.
- Executive Premier Workshop
- One-Day Options Course
- OptionsPro
- Retirement Income Workshop
- Sure-Fire Trading Systems (VectorVest, Inc.)
- Trading as a Business Workshop
- VectorVest 7 EOD
- VectorVest 7 RealTime/IntraDay
- VectorVest AutoTester
- VectorVest Educational Services
- VectorVest OnLine
- VectorVest Options Analyzer
- VectorVest ProGraphics v6.0
- VectorVest ProTrader 7
- VectorVest RealTime Derby Tool
- VectorVest Simulator
- VectorVest Variator
- VectorVest Watchdog
