HOT TOPICS LIST
- MACD
- Fibonacci
- RSI
- Gann
- ADXR
- Stochastics
- Volume
- Triangles
- Futures
- Cycles
- Volatility
- ZIGZAG
- MESA
- Retracement
- Aroon
INDICATORS LIST
LIST OF TOPICS
PRINT THIS ARTICLE
by David Penn
Weekly directional movement suggests upside for the former and downside for the latter.
Position: N/A
David Penn
Technical Writer for Technical Analysis of STOCKS & COMMODITIES magazine, Working-Money.com, and Traders.com Advantage.
PRINT THIS ARTICLE
ADXR
Greenbacks And Gold
10/19/06 08:55:04 AMby David Penn
Weekly directional movement suggests upside for the former and downside for the latter.
Position: N/A
| I've spent the past several weeks learning more about directional movement (see my Working-Money.com articles, "What's In A Trend?" from September 12 and "Trading DI+/-" from October 12). Although this J. Welles Wilder creation has a number of uses, I've been particularly busy deploying it as a general trend screen and, of late, using it with weekly charts in an attempt to spot new trends that are both (a) very early in their development and (b) potentially intermediate or longer term in nature. |

|
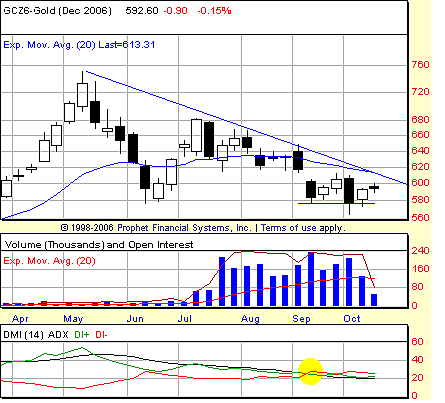
| FIGURE 1: DECEMBER GOLD, WEEKLY. A bearish crossover of the DI- line (in red) above the DI+ line (in green) in September emphasizes the possibility of a breakdown below the 580 level in gold. This bearish signal would be confirmed if the ADX (in black) also crosses above the DI+ line in October. |
| Graphic provided by: Prophet Financial, Inc. |
| |
| I've also been spending more time looking at the commodities (my last successful look-see was in October cattle, which as of this writing was down five cents from when I wrote about its bearish prospects — "The Fall Of Feeder Cattle," Traders.com Advantage, September 29). This morning, I was comparing the nine-month, weekly directional movement charts of two commodities, the US greenback and gold. Unfortunately, what I saw will not be heartening to gold bugs. While much of the financial commentariat has been dropping unsubtle hints that commodities such as crude oil have reached a bottom, the weekly directional movement charts of the greenback and gold suggest to me that whatever upside the commodities have will be limited to the short term, and that the US dollar's advance that began in May is likely to continue over the intermediate term. |
| Why so? Consider first the weekly directional movement chart of gold in Figure 1. Overall, what we have is a market that is becoming more and more trendless. This makes sense insofar as gold has slipped into a moderately triangular consolidation since its May 2006 peak. The black average directional movement index (ADX) line has slipped below 20, and the bullish DI+ and bearish DI- lines are not much higher. Twice in September the bearish line crossed above the bullish one. Crossovers of the DI lines are often early indications of bullish- or bearishness, with the ADX crossover tending to confirm the move (ADX crossing over the bullish DI+ line would be a bearish development; ADX crossing over the bearish DI- line would be a bullish development). |

|
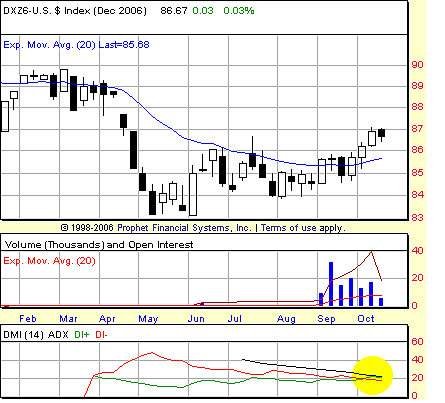
| FIGURE 2: DECEMBER US DOLLAR INDEX, WEEKLY. Although not as mature a chart as the one of December gold, this chart of the December greenback shows that there is plenty here that dollar bulls can appreciate. The bullish crossover of the DI+ line over the DI- line in early October comes as the DXZ6 continues to rally above and beyond the 20-week exponential moving average. |
| Graphic provided by: Prophet Financial, Inc. |
| |
| At present December gold is relying on support at the 580 level — this much is evident without the assistance of indicators. What the indicators are suggesting, what directional movement is suggesting, is that gold is on the verge of a significant move and the bias provided by the DI- crossing over the DI+ is bearish. This bearishness is underscored by the declining trendline from the May highs, the potential for resistance in the form of the 20-week exponential moving average (EMA) (in blue), and the relatively large distribution weeks for the weeks beginning September 11 and October 2. |
| If gold is balancing on support at 580, then the greenback seems to have broken through its balance beam at 86 (Figure 2). In a reverse cup with handle pattern (would that be a pistol?) that saw the December greenback make a handle-like dip over the course of May, then a longer scalloping pattern from late June through September, the greenback saw its DI+ line cross over its DI- line in the week beginning October 9 and has continued to move higher ever since. Continued progress upward in the greenback is almost certain to prompt further declines in gold. The extreme point for a DI+/DI- based entry in December gold, by the way, is 87.08. Note that is a weekly close–based number. |
Technical Writer for Technical Analysis of STOCKS & COMMODITIES magazine, Working-Money.com, and Traders.com Advantage.
| Title: | Technical Writer |
| Company: | Technical Analysis, Inc. |
| Address: | 4757 California Avenue SW |
| Seattle, WA 98116 | |
| Phone # for sales: | 206 938 0570 |
| Fax: | 206 938 1307 |
| Website: | www.Traders.com |
| E-mail address: | DPenn@traders.com |
Traders' Resource Links | |
| Charting the Stock Market: The Wyckoff Method -- Books | |
| Working-Money.com -- Online Trading Services | |
| Traders.com Advantage -- Online Trading Services | |
| Technical Analysis of Stocks & Commodities -- Publications and Newsletters | |
| Working Money, at Working-Money.com -- Publications and Newsletters | |
| Traders.com Advantage -- Publications and Newsletters | |
| Professional Traders Starter Kit -- Software | |
Click here for more information about our publications!
Comments
Date: 10/20/06Rank: 3Comment:

Request Information From Our Sponsors
- StockCharts.com, Inc.
- Candle Patterns
- Candlestick Charting Explained
- Intermarket Technical Analysis
- John Murphy on Chart Analysis
- John Murphy's Chart Pattern Recognition
- John Murphy's Market Message
- MurphyExplainsMarketAnalysis-Intermarket Analysis
- MurphyExplainsMarketAnalysis-Visual Analysis
- StockCharts.com
- Technical Analysis of the Financial Markets
- The Visual Investor
- VectorVest, Inc.
- Executive Premier Workshop
- One-Day Options Course
- OptionsPro
- Retirement Income Workshop
- Sure-Fire Trading Systems (VectorVest, Inc.)
- Trading as a Business Workshop
- VectorVest 7 EOD
- VectorVest 7 RealTime/IntraDay
- VectorVest AutoTester
- VectorVest Educational Services
- VectorVest OnLine
- VectorVest Options Analyzer
- VectorVest ProGraphics v6.0
- VectorVest ProTrader 7
- VectorVest RealTime Derby Tool
- VectorVest Simulator
- VectorVest Variator
- VectorVest Watchdog
