HOT TOPICS LIST
- MACD
- Fibonacci
- RSI
- Gann
- ADXR
- Stochastics
- Volume
- Triangles
- Futures
- Cycles
- Volatility
- ZIGZAG
- MESA
- Retracement
- Aroon
INDICATORS LIST
LIST OF TOPICS
PRINT THIS ARTICLE
by Koos van der Merwe
Very few traders do NOT listen to CNBC.
Position: N/A
Koos van der Merwe
Has been a technical analyst since 1969, and has worked as a futures and options trader with First Financial Futures in Johannesburg, South Africa.
PRINT THIS ARTICLE
ELLIOTT WAVE
The Dow And CNBC
10/18/06 11:50:00 AMby Koos van der Merwe
Very few traders do NOT listen to CNBC.
Position: N/A
| Sometime toward the end of the 1990s, CNBC interviewed the legendary Joe Granville, founder of the on-balance volume (OBV) method of trading the market. I remember Mark Haines interviewing him on Squawk Box, and I will never forget Granville's statement, one that appears to have banned him from ever being interviewed on CNBC again. Granville's statement? He said: "I turn off the sound when I watch CNBC and only watch the ticker." |

|
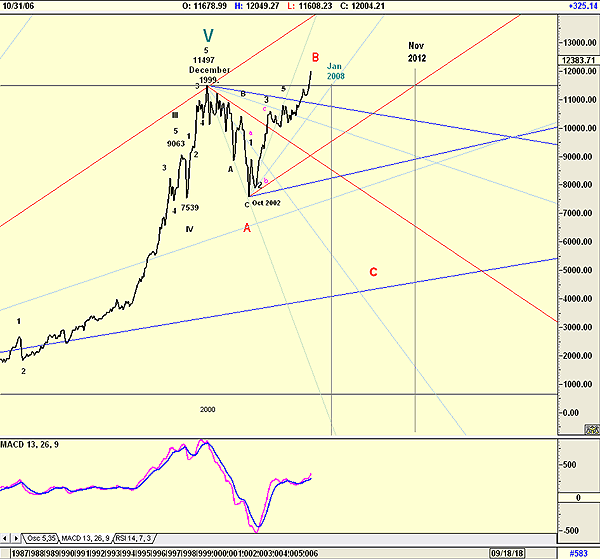
| FIGURE 1: DOW JONES INDUSTRIAL AVERAGE, MONTHLY. Note here that the DJIA has broken above the high made in December 1999. It also suggests two possible turning points ... one in January 2008 and one in November 2012. |
| Graphic provided by: AdvancedGET. |
| |
| The recent hype magnified by CNBC of the Dow Jones Industrial Average (DJIA) breaking above the 12,000 mark reminds me of the days preceding the 2000 bubble bursting and tempts me to follow Granville's advice. Toward this end, I offer you three charts for consideration. The first is of the DJIA, the second the Standard & Poor's 500, and the third of the DJIA divided by the consumer price index (CPI). Figrue 1 is a line chart of the monthly DJIA and shows how it has broken above the high made in December 1999. It also suggests two possible turning points: one in January 2008 and one in November 2012. The moving average convergence/divergence (MACD) indicator has moved positive, but this could be suspect, as suggested by the trend prior to 2000. |
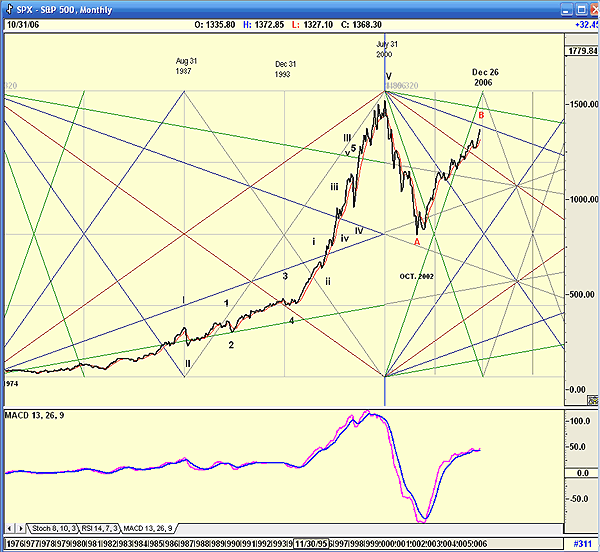
| Figure 2 is the S&P 500 monthly index, overlaid with Gann fans and showing an Elliott wave count. The MACD did give a sell signal a short while back but has now moved positive once again. Do note that the Gann fans are calling for a high in December 2006. Previous highs called were remarkably accurate. |

|
| |
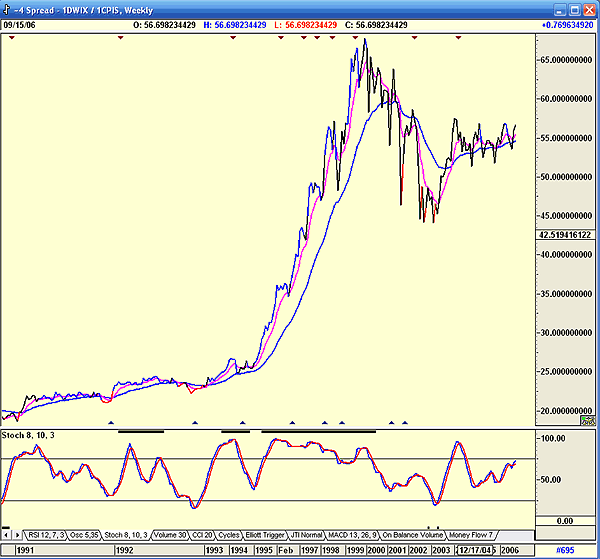
| Figure 3 is of the DJIA adjusted by the CPI. Note here the DJIA has not made a new high and the stochastic indicator is suggesting the trend is in a correction with the main trend down. Despite the hype of the DJIA making new highs, I am still bearish. If I am wrong, I will be a late entry into a new bull market, but if I am correct, then my capital is at the very least preserved to be invested at leisure. Either way, I will sleep at night. |

|
| |
Has been a technical analyst since 1969, and has worked as a futures and options trader with First Financial Futures in Johannesburg, South Africa.
| Address: | 3256 West 24th Ave |
| Vancouver, BC | |
| Phone # for sales: | 6042634214 |
| E-mail address: | petroosp@gmail.com |
Click here for more information about our publications!
Comments
Date: 10/20/06Rank: 3Comment:

Request Information From Our Sponsors
- StockCharts.com, Inc.
- Candle Patterns
- Candlestick Charting Explained
- Intermarket Technical Analysis
- John Murphy on Chart Analysis
- John Murphy's Chart Pattern Recognition
- John Murphy's Market Message
- MurphyExplainsMarketAnalysis-Intermarket Analysis
- MurphyExplainsMarketAnalysis-Visual Analysis
- StockCharts.com
- Technical Analysis of the Financial Markets
- The Visual Investor
- VectorVest, Inc.
- Executive Premier Workshop
- One-Day Options Course
- OptionsPro
- Retirement Income Workshop
- Sure-Fire Trading Systems (VectorVest, Inc.)
- Trading as a Business Workshop
- VectorVest 7 EOD
- VectorVest 7 RealTime/IntraDay
- VectorVest AutoTester
- VectorVest Educational Services
- VectorVest OnLine
- VectorVest Options Analyzer
- VectorVest ProGraphics v6.0
- VectorVest ProTrader 7
- VectorVest RealTime Derby Tool
- VectorVest Simulator
- VectorVest Variator
- VectorVest Watchdog
