HOT TOPICS LIST
- MACD
- Fibonacci
- RSI
- Gann
- ADXR
- Stochastics
- Volume
- Triangles
- Futures
- Cycles
- Volatility
- ZIGZAG
- MESA
- Retracement
- Aroon
INDICATORS LIST
LIST OF TOPICS
PRINT THIS ARTICLE
by Paolo Pezzutti
This stock is moving within a tight congestion, characterized by a low volatility level. From here, a new trend will emerge soon.
Position: N/A
Paolo Pezzutti
Author of the book "Trading the US Markets - A Comprehensive Guide to US Markets for International Traders and Investors" - Harriman House (July 2008)
PRINT THIS ARTICLE
VOLATILITY
Goodyear Tire & Rubber In Congestion
10/16/06 09:41:45 AMby Paolo Pezzutti
This stock is moving within a tight congestion, characterized by a low volatility level. From here, a new trend will emerge soon.
Position: N/A
| The Goodyear Tire & Rubber Co. is a well-known manufacturer of tires and rubber products, present commercially in most regions of the world. News about the world's third-largest tiremaker were not positive last week. The company borrowed $975 million to provide additional cash in the unlikely event that the strike of more than 12,000 union workers in the US and Canada continues longer than expected. From the fundamentals side, the company's revenue increased 2% to $10 billion as of June 30, 2006, reflecting global higher sales. In addition, the net income increased 45% to $76 million. |

|
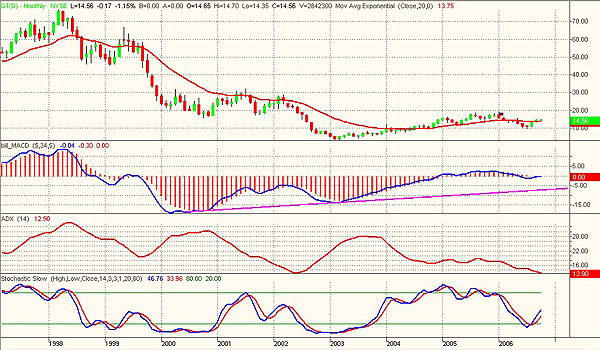
| FIGURE 1: GOODYEAR, MONTHLY. During the past three years, the stock has printed a very respectable performance, but prices are still far from the 1998 levels. |
| Graphic provided by: TradeStation. |
| |
| Technically, in Figure 1, you can see that the monthly chart displays how the stock, after the top printed in 1998 at about $77, developed a downtrend that ended in 2003 with a low of $3.35 in February. Quite impressive how much money got burnt during those five years. Since 2003, however, the stock has managed to print very good gains reaching the relative high of $18.56 in August 2006, but still very far from the previous capitalization of the company. At the monthly level, the 2003 low was associated to a significant positive divergence of the moving average convergence/divergence (MACD) indicator that supported the following rebound. The average directional movement index (ADX), which helps measure the strength of a trend, is printing very low levels at 12.90 and still decreasing and indicates the lack of a defined trend. The stochastic slow has turned up, leaving the oversold area. In this time frame, it seems that the stock still has room to continue its move to the upside. |

|
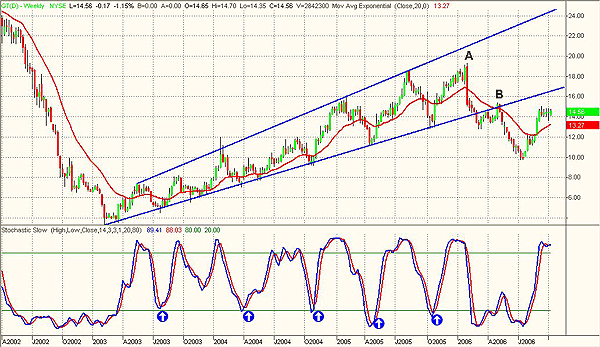
| FIGURE 2: GOODYEAR, WEEKLY. The stochastic indicator provided very good entry points during the uptrend. After the breakout of the channel to the downside, prices are trying to retest the lower trendline. |
| Graphic provided by: TradeStation. |
| |
| The weekly chart in Figure 2 is very interesting. Note how the uptrend started in 2003 has developed regularly within a slightly diverging channel. The lower trendline has been tested many times and the stochastic has provided good entry points during the up move. We wish it were always like this! In addition, the exit from the channel to the downside seems to be drawn for a technical analysis book. At point A, prices did not manage to tag again the upper trendline.That was the sign the move was about to come to an end. This indication was reinforced by a long black candle printed on February 3, 2006; we would see lower prices in this time frame. In fact, the stock printed a breakout to the downside and at point B attempted to enter again the upward channel, but without success. Prices turned down again to develop a new down leg. Since July, the stock has recovered about 40% of its value, moving from a low at about $10 to the present $14. Not bad indeed. Now, the stochastic is overbought and prices are moving within a tight range in a congestion that began early in September. |

|
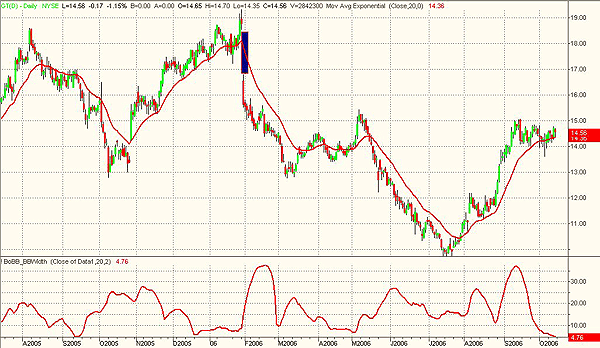
| FIGURE 3: GOODYEAR, DAILY. The Bollinger Bandwidth indicator is at the lowest level since September 2005. A new trend will emerge when prices brekout the tight congestion initiated last September. |
| Graphic provided by: TradeStation. |
| |
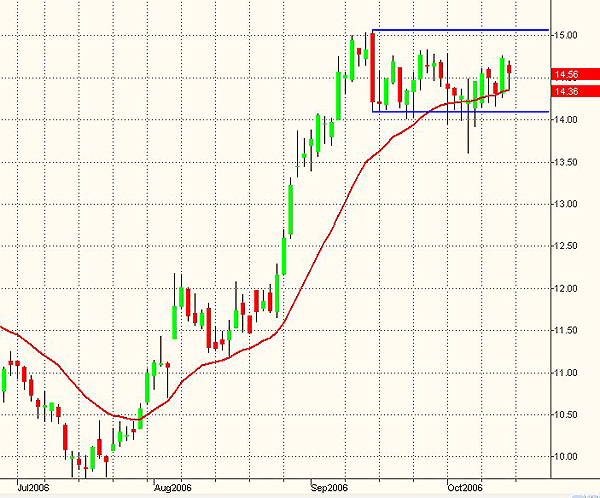
| At the daily level (Figure 3), you can see that on September 15, the stock printed a measuring bar. The next 20 bars have the open and the close within that range (Figure 4). The decline in volatility can also be observed using the Bollinger Bandwidth indicator. This indicator is calculated subtracting the lower band from the upper band and then normalizing the result after you divide it by the middle band. The width of the bands is expressed as a percent of the moving average. Using BandWidth, you can exploit one with the squeeze setup. When the bands get very narrow, you can expect a sharp expansion in volatility. A fall in volatility to extremely low levels suggests a sudden increase in volatility and a trend in the near future. The squeeze is triggered when BandWidth falls to its lowest level in the past six months. The present value of the Bandwidth indicator is 4.76, the lowest level since September 2005. Applying breakout techniques in this situation can be very profitable. Of course, you can apply your stop-loss with discipline, because the expected high-volatility environment could bring heavy losses. |

|
| FIGURE 4: GOODYEAR, DAILY, After 20 bars, prices are still moving within the range of the measuring that initiated the congestion. |
| Graphic provided by: TradeStation. |
| |
| In this phase it is difficult to say whether a breakout of the congestion area is going to be to the upside or the downside. Normally, congestions appear as consolidation areas from which the original trend resumes to continue the move in the previous direction, in this case to the upside. Longer time frames suggest there may be room to continue the recovery of prices. However, an option would be to trade the breakout in either direction with the expectation that from here a new trend will emerge in the short term and that it will be characterized by increased volatility. |
Author of the book "Trading the US Markets - A Comprehensive Guide to US Markets for International Traders and Investors" - Harriman House (July 2008)
| Address: | VIA ROBERTO AGO 26 POSTAL CODE 00166 |
| Rome, ITALY | |
| Phone # for sales: | +393357540708 |
| E-mail address: | pezzutti.paolo@tiscali.it |
Click here for more information about our publications!
Comments
Date: 10/20/06Rank: 3Comment:

Request Information From Our Sponsors
- VectorVest, Inc.
- Executive Premier Workshop
- One-Day Options Course
- OptionsPro
- Retirement Income Workshop
- Sure-Fire Trading Systems (VectorVest, Inc.)
- Trading as a Business Workshop
- VectorVest 7 EOD
- VectorVest 7 RealTime/IntraDay
- VectorVest AutoTester
- VectorVest Educational Services
- VectorVest OnLine
- VectorVest Options Analyzer
- VectorVest ProGraphics v6.0
- VectorVest ProTrader 7
- VectorVest RealTime Derby Tool
- VectorVest Simulator
- VectorVest Variator
- VectorVest Watchdog
- StockCharts.com, Inc.
- Candle Patterns
- Candlestick Charting Explained
- Intermarket Technical Analysis
- John Murphy on Chart Analysis
- John Murphy's Chart Pattern Recognition
- John Murphy's Market Message
- MurphyExplainsMarketAnalysis-Intermarket Analysis
- MurphyExplainsMarketAnalysis-Visual Analysis
- StockCharts.com
- Technical Analysis of the Financial Markets
- The Visual Investor
