HOT TOPICS LIST
- MACD
- Fibonacci
- RSI
- Gann
- ADXR
- Stochastics
- Volume
- Triangles
- Futures
- Cycles
- Volatility
- ZIGZAG
- MESA
- Retracement
- Aroon
INDICATORS LIST
LIST OF TOPICS
PRINT THIS ARTICLE
by Paolo Pezzutti
The fast-food chain stock is developing an uptrend in the intermediate time frame. Pushed by earnings news, the stock has printed what could be an exhaustion up gap after an extended move.
Position: N/A
Paolo Pezzutti
Author of the book "Trading the US Markets - A Comprehensive Guide to US Markets for International Traders and Investors" - Harriman House (July 2008)
PRINT THIS ARTICLE
GAPS
McDonald's Prints New Highs
10/13/06 02:19:06 PMby Paolo Pezzutti
The fast-food chain stock is developing an uptrend in the intermediate time frame. Pushed by earnings news, the stock has printed what could be an exhaustion up gap after an extended move.
Position: N/A
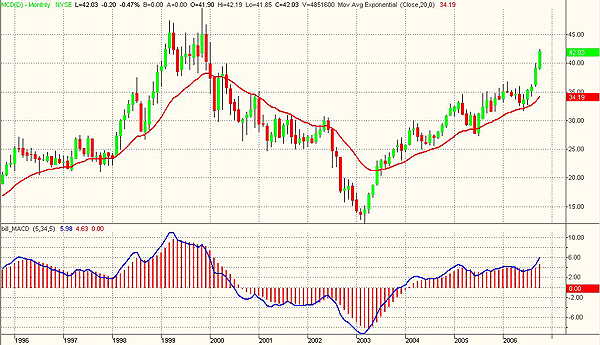
| McDonald's (MCD) increased its dividend of nearly 50% from 67 cents to $1.00 per share, totaling about $1.2 billion. The move reflects confidence in the business strength. The company has raised its dividend every year since paying its first dividend 30 years ago. It has more than quadrupled the dividend from 23.5 cents per share in 2002 to $1.00 per share in 2006. Moreover, the company announced that sales growth in the last quarter has been strong in US, Europe, and Asia. Technically, positive news about the stock's fundamentals are reflected in the uptrend printed since 2003. The monthly chart (Figure 1) displays that prices are very close to all-time highs printed at the end of 1999. McDonald's printed a low in March 2003 at about $12. Investors who put their money in the stock have been very well rewarded, with their initial investment more than tripled in three years. |

|
| FIGURE 1: MCDONALD, MONTHLY. The MCD stock is very close to all-time highs. |
| Graphic provided by: TradeStation. |
| |
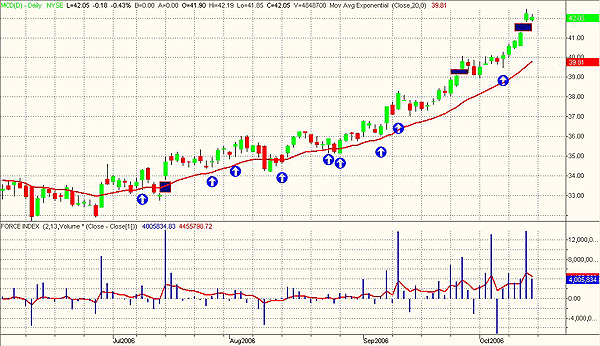
| In the daily chart (Figure 2), you can see that the up leg initiated at the end of June brought prices from the low of $31.91 of June 28 to the $42.46 high printed on October 12. The uptrend has been characterized by a fast impulse to the upside, pushed by good earnings news. Generally speaking, the smart money are shifting their focus toward the defensive sectors. The stock trend is strong with fresh money entering the marketplace and pushing prices higher with few, limited pullbacks. In these cases, the force index indicator is very efficient in providing low-risk entry points to traders. The force index attempts to measure the force of bulls during uptrends and the force of bears in downtrends, taking into account price and volume. A positive close of prices will print a positive force, and a negative close of prices will print a negative force. The greater the volume, the greater the force. The greater the price change, the greater the force. The short-term force index is smoothed with a two-day exponential moving average (EMA). A 13-day EMA of the force index helps to track the longer-term trend. Where there is an indication of an uptrend, you will spot an entry point when the two-day EMA of the force index is negative, placing a buy order above the high of that day. The opposite is true during downtrend. In Figure 2, you can see how the indicator has worked well during the uptrend, providing entry points during the pullbacks. |

|
| FIGURE 2: MCDONALD, DAILY. The force index has helped traders spot low-risk entry points during the uptrend. The last up gap could be an exhaustion gap. |
| Graphic provided by: TradeStation. |
| |
| MCD has printed three gaps since June. The gap printed on July 17 can be viewed as a breakway gap. Typically, this gap occurs when prices climb above a trading range, appearing as the stock breaks out into a new trend move. On September 27, what could seem at first an exhaustion gap in reality was a continuation gap. These gaps are printed when a trend accelerates. You can have more than one gap in a trend. The gap that printed on October 12 could have the characteristics of an exhaustion gap printed after a parabolic move. After an extended trend, often this gap is soon followed by a trend reversal. The market opens higher and rallies, just for that day or a few days. It is difficult to predict a reversal. You will have more indications in case of a gap closure. In that case, it is very likely that weakness would be ahead in the short term. |
| In this situation, I would not open long positions, although the stock in the intermediate term is interesting. The possibility of seeing lower prices is serious and risk is too high at these levels. The risk-reward ratio is not attractive, as a correction could start at any moment. The first support is identified at the $40 level. |
Author of the book "Trading the US Markets - A Comprehensive Guide to US Markets for International Traders and Investors" - Harriman House (July 2008)
| Address: | VIA ROBERTO AGO 26 POSTAL CODE 00166 |
| Rome, ITALY | |
| Phone # for sales: | +393357540708 |
| E-mail address: | pezzutti.paolo@tiscali.it |
Click here for more information about our publications!
Comments
Date: 10/13/06Rank: 3Comment:

Request Information From Our Sponsors
- StockCharts.com, Inc.
- Candle Patterns
- Candlestick Charting Explained
- Intermarket Technical Analysis
- John Murphy on Chart Analysis
- John Murphy's Chart Pattern Recognition
- John Murphy's Market Message
- MurphyExplainsMarketAnalysis-Intermarket Analysis
- MurphyExplainsMarketAnalysis-Visual Analysis
- StockCharts.com
- Technical Analysis of the Financial Markets
- The Visual Investor
- VectorVest, Inc.
- Executive Premier Workshop
- One-Day Options Course
- OptionsPro
- Retirement Income Workshop
- Sure-Fire Trading Systems (VectorVest, Inc.)
- Trading as a Business Workshop
- VectorVest 7 EOD
- VectorVest 7 RealTime/IntraDay
- VectorVest AutoTester
- VectorVest Educational Services
- VectorVest OnLine
- VectorVest Options Analyzer
- VectorVest ProGraphics v6.0
- VectorVest ProTrader 7
- VectorVest RealTime Derby Tool
- VectorVest Simulator
- VectorVest Variator
- VectorVest Watchdog
