HOT TOPICS LIST
- MACD
- Fibonacci
- RSI
- Gann
- ADXR
- Stochastics
- Volume
- Triangles
- Futures
- Cycles
- Volatility
- ZIGZAG
- MESA
- Retracement
- Aroon
INDICATORS LIST
LIST OF TOPICS
PRINT THIS ARTICLE
by Arthur Hill
A high-volume bounce off support suggests an end to Altera's correction.
Position: Buy
Arthur Hill
Arthur Hill is currently editor of TDTrader.com, a website specializing in trading strategies, sector/industry specific breadth stats and overall technical analysis. He passed the Society of Technical Analysts (STA London) diploma exam with distinction is a Certified Financial Technician (CFTe). Prior to TD Trader, he was the Chief Technical Analyst for Stockcharts.com and the main contributor to the ChartSchool.
PRINT THIS ARTICLE
REGRESSION ANALYSIS
Altera Challenges Regression Resistance
10/12/06 08:50:04 AMby Arthur Hill
A high-volume bounce off support suggests an end to Altera's correction.
Position: Buy
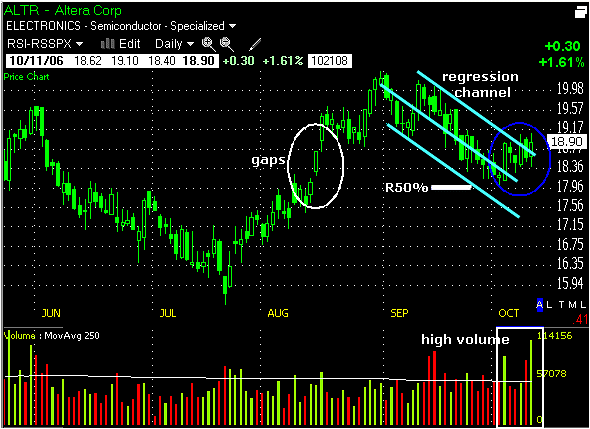
| Altera (ALTR) surged from mid-July to late August and then corrected in September (Figure 1). The move broke above the 200-day moving regression line and the stock met resistance around 20. The 200-day moving regression line is exactly what it seems: a 200-day regression point that moves with the daily closing prices. The current datapoint represents a regression of the last 200 closing prices. It works just like a moving average by offering support in an uptrend and resistance in a downtrend. The break above the 200-day moving regression is bullish and this line is now acting as support around 18. |
| In addition to the 200-day moving regression line, the mid-August gap and a 50% retracement of the July–August advance also mark support around 18. Even though it was summer, the mid-August gap occurred on above-average volume (blue ovals), and this gap now becomes support. After a run from 15.5 to 20.5, some sort of pullback can be expected, and it is normal for a stock to retrace around 50% of the prior advance. All signs point to support and we must now look for evidence of a sustainable bounce. |

|
| FIGURE 1: ALTERA. ALTR surged from mid-July to late August before correcting in September. |
| Graphic provided by: TC2000.com. |
| Graphic provided by: TeleChart 2007. |
| |
| The stock bounced off support over the last seven days and broke the upper trendline of a regression channel. The middle line is the linear regression. The upper and lower trendlines are parallel. The stock bounced off 18 with good volume and closed above the upper channel trendline. The high-volume move validates the breakout and reinforces support at 18. I now expect a challenge to the September high and will stay bullish as long as key support at 18 holds. |
Arthur Hill is currently editor of TDTrader.com, a website specializing in trading strategies, sector/industry specific breadth stats and overall technical analysis. He passed the Society of Technical Analysts (STA London) diploma exam with distinction is a Certified Financial Technician (CFTe). Prior to TD Trader, he was the Chief Technical Analyst for Stockcharts.com and the main contributor to the ChartSchool.
| Title: | Editor |
| Company: | TDTrader.com |
| Address: | Willem Geetsstraat 17 |
| Mechelen, B2800 | |
| Phone # for sales: | 3215345465 |
| Website: | www.tdtrader.com |
| E-mail address: | arthurh@tdtrader.com |
Traders' Resource Links | |
| TDTrader.com has not added any product or service information to TRADERS' RESOURCE. | |
Click here for more information about our publications!
Comments
Date: 10/13/06Rank: 5Comment: another test text
Date: 10/13/06Rank: 4Comment:

Request Information From Our Sponsors
- StockCharts.com, Inc.
- Candle Patterns
- Candlestick Charting Explained
- Intermarket Technical Analysis
- John Murphy on Chart Analysis
- John Murphy's Chart Pattern Recognition
- John Murphy's Market Message
- MurphyExplainsMarketAnalysis-Intermarket Analysis
- MurphyExplainsMarketAnalysis-Visual Analysis
- StockCharts.com
- Technical Analysis of the Financial Markets
- The Visual Investor
- VectorVest, Inc.
- Executive Premier Workshop
- One-Day Options Course
- OptionsPro
- Retirement Income Workshop
- Sure-Fire Trading Systems (VectorVest, Inc.)
- Trading as a Business Workshop
- VectorVest 7 EOD
- VectorVest 7 RealTime/IntraDay
- VectorVest AutoTester
- VectorVest Educational Services
- VectorVest OnLine
- VectorVest Options Analyzer
- VectorVest ProGraphics v6.0
- VectorVest ProTrader 7
- VectorVest RealTime Derby Tool
- VectorVest Simulator
- VectorVest Variator
- VectorVest Watchdog
