HOT TOPICS LIST
- MACD
- Fibonacci
- RSI
- Gann
- ADXR
- Stochastics
- Volume
- Triangles
- Futures
- Cycles
- Volatility
- ZIGZAG
- MESA
- Retracement
- Aroon
INDICATORS LIST
LIST OF TOPICS
PRINT THIS ARTICLE
by Arthur Hill
With a momentum oscillator turning up and gap higher, Rambus appears set to continue the August advance.
Position: Accumulate
Arthur Hill
Arthur Hill is currently editor of TDTrader.com, a website specializing in trading strategies, sector/industry specific breadth stats and overall technical analysis. He passed the Society of Technical Analysts (STA London) diploma exam with distinction is a Certified Financial Technician (CFTe). Prior to TD Trader, he was the Chief Technical Analyst for Stockcharts.com and the main contributor to the ChartSchool.
PRINT THIS ARTICLE
GAPS
Is Rambus Ready To Rumble?
10/12/06 08:41:49 AMby Arthur Hill
With a momentum oscillator turning up and gap higher, Rambus appears set to continue the August advance.
Position: Accumulate
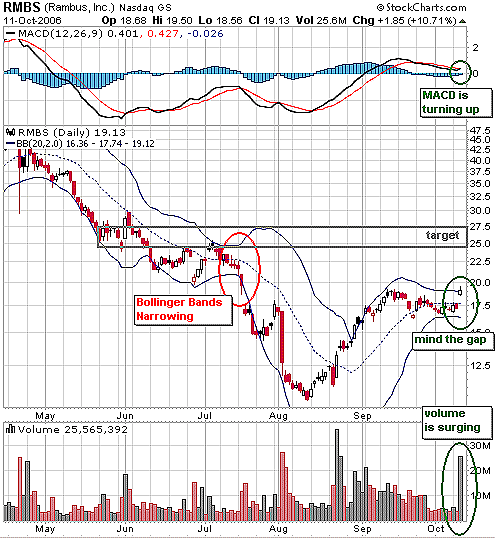
| On the price chart (Figure 1), Rambus (RMBS) declined sharply from April to August then quickly reversed with a sharp rally in the second half of August. The rally featured high volume and carried the stock above 17.5 in early September. A consolidation period then unfolded and the stock broke out with a high-volume gap above 18. This high-volume breakout shows renewed interest and validates the move. |
| The consolidation is evident by the narrow price range over the last few weeks and the contracting Bollinger Bands. Note the Bollinger Bands also contracted in July and the sudden move to the lower band foreshadowed a sharp decline below 12.5 (red oval). The opposite is taking place now as prices surge to the upper band. The breakout targets a move to the 25–27 area or to resistance from the late June–early July highs. The October low at 16.7 becomes key support, and this is the level to watch for a failure. |

|
| FIGURE 1: RAMBUS. RMBS dropped from April to August before turning back up in late August. |
| Graphic provided by: StockCharts.com. |
| |
| Momentum is also turning up. The moving average convergence/divergence (MACD) formed a positive divergence from late May to mid-August and moved into positive territory in September. This momentum oscillator pulled back over the last few weeks but held in positive territory. The MACD turned up yesterday but has yet to break above its signal line (red line). As long as the gap holds, I would expect the MACD to move back above its signal line and upside momentum to gather steam. |
Arthur Hill is currently editor of TDTrader.com, a website specializing in trading strategies, sector/industry specific breadth stats and overall technical analysis. He passed the Society of Technical Analysts (STA London) diploma exam with distinction is a Certified Financial Technician (CFTe). Prior to TD Trader, he was the Chief Technical Analyst for Stockcharts.com and the main contributor to the ChartSchool.
| Title: | Editor |
| Company: | TDTrader.com |
| Address: | Willem Geetsstraat 17 |
| Mechelen, B2800 | |
| Phone # for sales: | 3215345465 |
| Website: | www.tdtrader.com |
| E-mail address: | arthurh@tdtrader.com |
Traders' Resource Links | |
| TDTrader.com has not added any product or service information to TRADERS' RESOURCE. | |
Click here for more information about our publications!
Comments
Date: 10/13/06Rank: 4Comment:

Request Information From Our Sponsors
- VectorVest, Inc.
- Executive Premier Workshop
- One-Day Options Course
- OptionsPro
- Retirement Income Workshop
- Sure-Fire Trading Systems (VectorVest, Inc.)
- Trading as a Business Workshop
- VectorVest 7 EOD
- VectorVest 7 RealTime/IntraDay
- VectorVest AutoTester
- VectorVest Educational Services
- VectorVest OnLine
- VectorVest Options Analyzer
- VectorVest ProGraphics v6.0
- VectorVest ProTrader 7
- VectorVest RealTime Derby Tool
- VectorVest Simulator
- VectorVest Variator
- VectorVest Watchdog
- StockCharts.com, Inc.
- Candle Patterns
- Candlestick Charting Explained
- Intermarket Technical Analysis
- John Murphy on Chart Analysis
- John Murphy's Chart Pattern Recognition
- John Murphy's Market Message
- MurphyExplainsMarketAnalysis-Intermarket Analysis
- MurphyExplainsMarketAnalysis-Visual Analysis
- StockCharts.com
- Technical Analysis of the Financial Markets
- The Visual Investor
