HOT TOPICS LIST
- MACD
- Fibonacci
- RSI
- Gann
- ADXR
- Stochastics
- Volume
- Triangles
- Futures
- Cycles
- Volatility
- ZIGZAG
- MESA
- Retracement
- Aroon
INDICATORS LIST
LIST OF TOPICS
PRINT THIS ARTICLE
by Arthur Hill
An overextended price chart and overbought momentum oscillator suggest the Spain iShares exchange traded fund is vulnerable to a correction.
Position: Hold
Arthur Hill
Arthur Hill is currently editor of TDTrader.com, a website specializing in trading strategies, sector/industry specific breadth stats and overall technical analysis. He passed the Society of Technical Analysts (STA London) diploma exam with distinction is a Certified Financial Technician (CFTe). Prior to TD Trader, he was the Chief Technical Analyst for Stockcharts.com and the main contributor to the ChartSchool.
PRINT THIS ARTICLE
OVERBOUGHT OVERSOLD
Spain Is Getting Frothy
10/10/06 03:08:15 PMby Arthur Hill
An overextended price chart and overbought momentum oscillator suggest the Spain iShares exchange traded fund is vulnerable to a correction.
Position: Hold
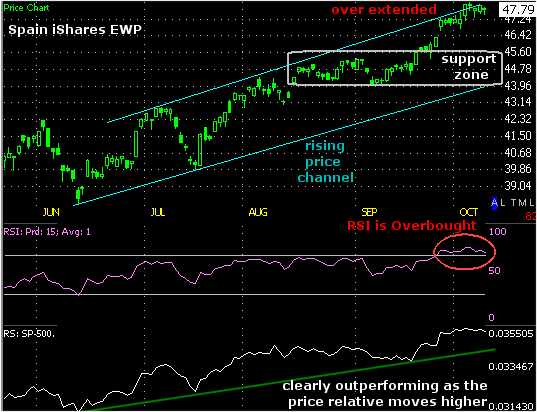
| The Spain iShares ETF (EWP) has been one of the top-performing exchange traded funds (ETFs) over the last four months. The ETF surged more than 25% from mid-June to early October. In the process, the ETF easily outperformed the Standard & Poor's 500. The bottom indicator shows the price relative (EWP/SPX ratio). EWP outperforms when this line moves higher, and the indicator clearly moved from the lower left-hand corner to the upper right-hand corner (uptrend). |
| Despite a clear and present uptrend, EWP is overextended on the price chart and ripe for a correction (Figure 1). The lower trendline extends up from the June low and the upper trendline is parallel. Together, these trendlines form a rising price channel that should contain prices. EWP moved above the upper trendline this month, and this created an overextended situation. The likely remedy is a correction and the ETF could easily pull back to the mid-40s. Support in this area is marked by the lower channel trendline and the late August/early September consolidation (gray box). |

|
| FIGURE 1: SPAIN ISHARES ETF. One of the top-performing ETFs in recent days, this ETF surged more than 25% from mid-June to early October. |
| Graphic provided by: TC2000.com. |
| Graphic provided by: TeleChart 2007. |
| |
| The relative strength index (RSI) is also overbought and ripe for a pullback. The RSI moved from oversold levels in mid-June to overbought levels in late September. Despite a strong advance from mid-July to mid-August, the RSI did not become overbought (above 70) during the summer. The latest advance, however, was enough to trigger overbought conditions. At this point, it would be prudent to wait for momentum (RSI) to pull back as well. The RSI often finds support around 50 in an uptrend, and I would look for a pullback to around 50 before considering long positions. |
Arthur Hill is currently editor of TDTrader.com, a website specializing in trading strategies, sector/industry specific breadth stats and overall technical analysis. He passed the Society of Technical Analysts (STA London) diploma exam with distinction is a Certified Financial Technician (CFTe). Prior to TD Trader, he was the Chief Technical Analyst for Stockcharts.com and the main contributor to the ChartSchool.
| Title: | Editor |
| Company: | TDTrader.com |
| Address: | Willem Geetsstraat 17 |
| Mechelen, B2800 | |
| Phone # for sales: | 3215345465 |
| Website: | www.tdtrader.com |
| E-mail address: | arthurh@tdtrader.com |
Traders' Resource Links | |
| TDTrader.com has not added any product or service information to TRADERS' RESOURCE. | |
Click here for more information about our publications!
Comments
Date: 10/10/06Rank: 4Comment:

|

Request Information From Our Sponsors
- StockCharts.com, Inc.
- Candle Patterns
- Candlestick Charting Explained
- Intermarket Technical Analysis
- John Murphy on Chart Analysis
- John Murphy's Chart Pattern Recognition
- John Murphy's Market Message
- MurphyExplainsMarketAnalysis-Intermarket Analysis
- MurphyExplainsMarketAnalysis-Visual Analysis
- StockCharts.com
- Technical Analysis of the Financial Markets
- The Visual Investor
- VectorVest, Inc.
- Executive Premier Workshop
- One-Day Options Course
- OptionsPro
- Retirement Income Workshop
- Sure-Fire Trading Systems (VectorVest, Inc.)
- Trading as a Business Workshop
- VectorVest 7 EOD
- VectorVest 7 RealTime/IntraDay
- VectorVest AutoTester
- VectorVest Educational Services
- VectorVest OnLine
- VectorVest Options Analyzer
- VectorVest ProGraphics v6.0
- VectorVest ProTrader 7
- VectorVest RealTime Derby Tool
- VectorVest Simulator
- VectorVest Variator
- VectorVest Watchdog
