

HOT TOPICS LIST
- MACD
- Fibonacci
- RSI
- Gann
- ADXR
- Stochastics
- Volume
- Triangles
- Futures
- Cycles
- Volatility
- ZIGZAG
- MESA
- Retracement
- Aroon
INDICATORS LIST
LIST OF TOPICS
PRINT THIS ARTICLE
by Arthur Hill
Gannett sports an inverse head & shoulders pattern and signs of accumulation point to a breakout.
Position: Accumulate
Arthur Hill
Arthur Hill is currently editor of TDTrader.com, a website specializing in trading strategies, sector/industry specific breadth stats and overall technical analysis. He passed the Society of Technical Analysts (STA London) diploma exam with distinction is a Certified Financial Technician (CFTe). Prior to TD Trader, he was the Chief Technical Analyst for Stockcharts.com and the main contributor to the ChartSchool.
PRINT THIS ARTICLE
HEAD & SHOULDERS
Gannett Looks To Break Out
10/10/06 10:53:39 AMby Arthur Hill
Gannett sports an inverse head & shoulders pattern and signs of accumulation point to a breakout.
Position: Accumulate
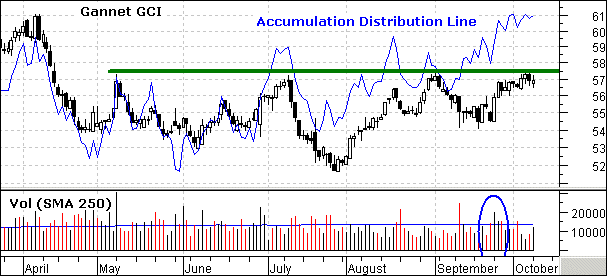
| The head & shoulders pattern formed on the daily chart over the last five months (Figure 1). The left shoulder bottomed in early June, the head in late July, and the right shoulder in mid-September. Neckline resistance resides around 57, and a break above this level would confirm this bullish reversal pattern. Based on traditional technical analysis, the upside target would be to the low 60s. |
| Volume is important for confirming an inverse head & shoulders pattern. Looking at the volume bars, upside volume was above average twice in late September (blue oval), and this coincides with the bounce that formed the right shoulder. However, upside volume was not impressive during the August advance. Volume is supposed to be low in August and I am not too concerned. |
|
| FIGURE 1: GANNETT, DAILY. The head & shoulders pattern formed on the daily chart of GCI over a span of five months in 2006. |
| Graphic provided by: MetaStock. |
| |
| Just to be sure, I overlaid the accumulation-distribution line and it shows evidence of accumulation. A higher low formed in late July and the indicator broke to new highs in August and again this month. Even though the stock traded flat from May to September, the rising in the accumulation-distribution line showed subtle buying pressure with a steady rise. |
|
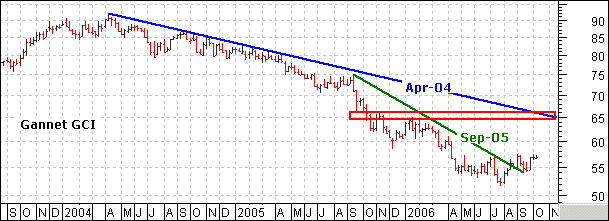
| FIGURE 2: GANNETT, WEEKLY. GCI would still remain in a long-term downtrend with resistance in the mid-60s if there were a medium-term bullish breakout at 57.5. |
| Graphic provided by: MetaStock. |
| |
| While a breakout at 57.5 would be medium-term bullish, the weekly chart shows that Gannett would still remain in long-term downtrend with resistance in the mid-60s (Figure 2). The stock broke the September 2005 trendline (green) in August but remains well below the April 2004 trendline (blue), which extends to the mid-60s. Resistance in the mid-60s is confirmed by the November 2005 and January 2006 highs (red rectangle). If GCI breaks head & shoulders resistance at 57.5, I would expect long-term resistance below 65. |
Arthur Hill is currently editor of TDTrader.com, a website specializing in trading strategies, sector/industry specific breadth stats and overall technical analysis. He passed the Society of Technical Analysts (STA London) diploma exam with distinction is a Certified Financial Technician (CFTe). Prior to TD Trader, he was the Chief Technical Analyst for Stockcharts.com and the main contributor to the ChartSchool.
| Title: | Editor |
| Company: | TDTrader.com |
| Address: | Willem Geetsstraat 17 |
| Mechelen, B2800 | |
| Phone # for sales: | 3215345465 |
| Website: | www.tdtrader.com |
| E-mail address: | arthurh@tdtrader.com |
Traders' Resource Links | |
| TDTrader.com has not added any product or service information to TRADERS' RESOURCE. | |
Click here for more information about our publications!
Comments
Date:�10/10/06Rank:�4Comment:�

Request Information From Our Sponsors
- VectorVest, Inc.
- Executive Premier Workshop
- One-Day Options Course
- OptionsPro
- Retirement Income Workshop
- Sure-Fire Trading Systems (VectorVest, Inc.)
- Trading as a Business Workshop
- VectorVest 7 EOD
- VectorVest 7 RealTime/IntraDay
- VectorVest AutoTester
- VectorVest Educational Services
- VectorVest OnLine
- VectorVest Options Analyzer
- VectorVest ProGraphics v6.0
- VectorVest ProTrader 7
- VectorVest RealTime Derby Tool
- VectorVest Simulator
- VectorVest Variator
- VectorVest Watchdog
- StockCharts.com, Inc.
- Candle Patterns
- Candlestick Charting Explained
- Intermarket Technical Analysis
- John Murphy on Chart Analysis
- John Murphy's Chart Pattern Recognition
- John Murphy's Market Message
- MurphyExplainsMarketAnalysis-Intermarket Analysis
- MurphyExplainsMarketAnalysis-Visual Analysis
- StockCharts.com
- Technical Analysis of the Financial Markets
- The Visual Investor