HOT TOPICS LIST
- MACD
- Fibonacci
- RSI
- Gann
- ADXR
- Stochastics
- Volume
- Triangles
- Futures
- Cycles
- Volatility
- ZIGZAG
- MESA
- Retracement
- Aroon
INDICATORS LIST
LIST OF TOPICS
PRINT THIS ARTICLE
by Koos van der Merwe
The theory goes that months before a rise in the market, paper products -- and that includes businesses that sell stationery -- start increasing in value.
Position: Accumulate
Koos van der Merwe
Has been a technical analyst since 1969, and has worked as a futures and options trader with First Financial Futures in Johannesburg, South Africa.
PRINT THIS ARTICLE
HEAD & SHOULDERS
Staples
10/06/06 11:45:45 AMby Koos van der Merwe
The theory goes that months before a rise in the market, paper products -- and that includes businesses that sell stationery -- start increasing in value.
Position: Accumulate
| The theory about the increasing value of paper products purveyors exists because as sales start improving in companies, more and more stationery is used. Therefore, we have a measure of a company's performance before results are released. |

|
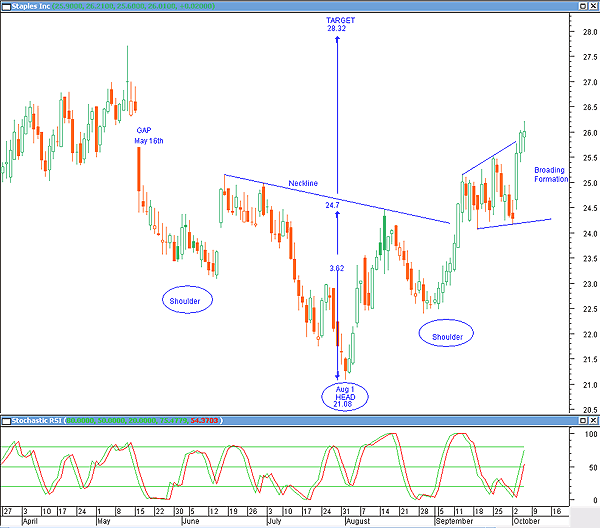
| FIGURE 1: STAPLES, DAILY. This shows the inverse head & shoulders formation. |
| Graphic provided by: MetaStock. |
| |
| Staples (SPLS) is one of those stationery businesses, and Figure 1 shows how it has moved up strongly from August 1, 2006. The chart shows an inverse head & shoulder pattern that formed after the falling gap of May 16. The target is $28.32, as shown on the chart. |
| What is a concern is the broadening formation that has formed recently. Experience shows that broadening formations (trumpets) are unreliable and can lead to movement in any direction. However, the breakout has been upward, so it is likely that movement will continue upward. The stochastic relative strength index (RSI) is also pointing up, suggesting strength. |

|
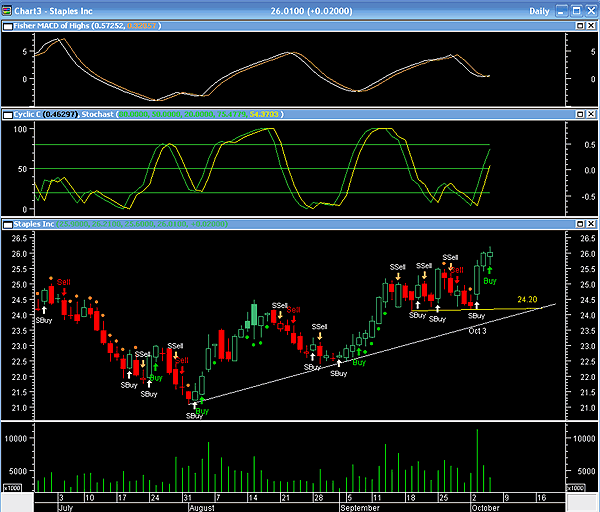
| FIGURE 2: STAPLES. This chart shows my preferred indicators. |
| Graphic provided by: MetaStock. |
| |
| In Figure 2, I have formulated the Expert Advisor of MetaStock to highlight buy and sell signals based on a Fisher transform formula of the moving average convergence/divergence (MACD), and a stochastic RSI of the cyclic component as suggested by John Ehlers. The Explorer is suggesting a buy signal given by the stochastic RSI on October 3 and recently confirmed by the Fisher MACD. The only negative point is that the stock rose on falling volume, a sign of weakness. |
| Would I buy SPLS at these levels? No, I would wait for a pullback, possibly to $24.20, the lower support level of the trumpet formation, purely because of the falling volume. But with the indicators suggesting a buy, it is very tempting to place a low-ball bid. Either way, the stock is one I shall be watching, and with a Dow Jones Industrial Average (DJIA) that is making new highs, contrary to many analysts calling for a recession in the US, I shall be a buyer at lower levels. |
Has been a technical analyst since 1969, and has worked as a futures and options trader with First Financial Futures in Johannesburg, South Africa.
| Address: | 3256 West 24th Ave |
| Vancouver, BC | |
| Phone # for sales: | 6042634214 |
| E-mail address: | petroosp@gmail.com |
Click here for more information about our publications!
Comments
Date: 10/06/06Rank: 5Comment:
Date: 10/06/06Rank: 2Comment:
Date: 10/12/06Rank: 5Comment:

Request Information From Our Sponsors
- VectorVest, Inc.
- Executive Premier Workshop
- One-Day Options Course
- OptionsPro
- Retirement Income Workshop
- Sure-Fire Trading Systems (VectorVest, Inc.)
- Trading as a Business Workshop
- VectorVest 7 EOD
- VectorVest 7 RealTime/IntraDay
- VectorVest AutoTester
- VectorVest Educational Services
- VectorVest OnLine
- VectorVest Options Analyzer
- VectorVest ProGraphics v6.0
- VectorVest ProTrader 7
- VectorVest RealTime Derby Tool
- VectorVest Simulator
- VectorVest Variator
- VectorVest Watchdog
- StockCharts.com, Inc.
- Candle Patterns
- Candlestick Charting Explained
- Intermarket Technical Analysis
- John Murphy on Chart Analysis
- John Murphy's Chart Pattern Recognition
- John Murphy's Market Message
- MurphyExplainsMarketAnalysis-Intermarket Analysis
- MurphyExplainsMarketAnalysis-Visual Analysis
- StockCharts.com
- Technical Analysis of the Financial Markets
- The Visual Investor
