HOT TOPICS LIST
- MACD
- Fibonacci
- RSI
- Gann
- ADXR
- Stochastics
- Volume
- Triangles
- Futures
- Cycles
- Volatility
- ZIGZAG
- MESA
- Retracement
- Aroon
INDICATORS LIST
LIST OF TOPICS
PRINT THIS ARTICLE
by Gary Grosschadl
Ultra Petroleum put in a hammer bottom several trading days ago. So what are the upside targets?
Position: Buy
Gary Grosschadl
Independent Canadian equities trader and technical analyst based in Peterborough
Ontario, Canada.
PRINT THIS ARTICLE
CHART ANALYSIS
Ultra Petroleum Rising Off A Recent Bottom
10/02/06 01:45:49 PMby Gary Grosschadl
Ultra Petroleum put in a hammer bottom several trading days ago. So what are the upside targets?
Position: Buy
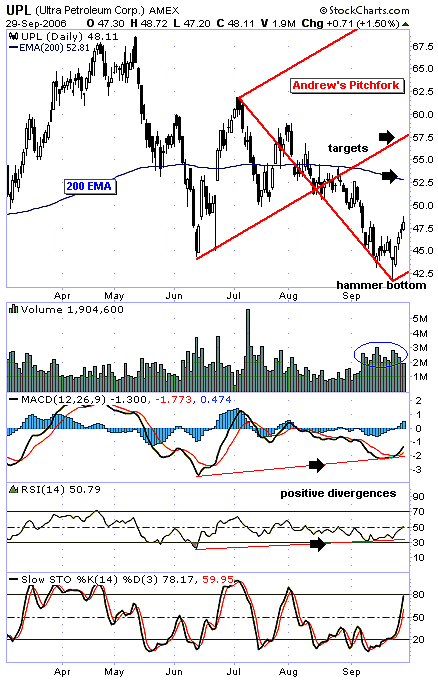
| Figure 1, a daily chart of Ultra Petroleum (UPL), shows a spring peak of $67.50 and a recent bottom near $42. This bottom area shows good volume, making the hammer candlestick more convincing. |
| Using three turning points, an Andrews pitchfork is plotted giving insight to possible lines of future support and resistance. Typically, if the pattern is good, the stock price will ride up between the tines of the fork and eventually will reach the median line or center line. After that, a return to the lower median line is likely as a support test. On rare occasions, a super bull move could carry beyond the median line to the upper median line. Note that on the way to the median line, the 200-day exponential moving average (EMA), currently 52.81, could also serve as a trading target to upside resistance. |

|
| FIGURE 1: ULTRA PETROLEUM, DAILY. This chart of UPL shows a bullish pointing pitchfork. |
| Graphic provided by: StockCharts.com. |
| |
| Several indicators are also considered. The moving average convergence/divergence (MACD) shows a bullish turn and crossover of its signal line. In addition, note the positive divergence to price action. Similarly, the relative strength index (RSI) shows its own positive divergence as well as a move just above the often key area of 50. The stochastic oscillator is approaching the overbought area of above 80. Once this oscillator moves back down below 80, a downleg is likely. |
| In summary, upside targets are the 200-day EMA and the median line of the pitchfork. The pitchfork has a overall bullish bias as long as the lower trendline (lower median line) holds support. |
Independent Canadian equities trader and technical analyst based in Peterborough
Ontario, Canada.
| Website: | www.whatsonsale.ca/financial.html |
| E-mail address: | gwg7@sympatico.ca |
Click here for more information about our publications!
Comments
Date: 10/03/06Rank: 5Comment:

Request Information From Our Sponsors
- StockCharts.com, Inc.
- Candle Patterns
- Candlestick Charting Explained
- Intermarket Technical Analysis
- John Murphy on Chart Analysis
- John Murphy's Chart Pattern Recognition
- John Murphy's Market Message
- MurphyExplainsMarketAnalysis-Intermarket Analysis
- MurphyExplainsMarketAnalysis-Visual Analysis
- StockCharts.com
- Technical Analysis of the Financial Markets
- The Visual Investor
- VectorVest, Inc.
- Executive Premier Workshop
- One-Day Options Course
- OptionsPro
- Retirement Income Workshop
- Sure-Fire Trading Systems (VectorVest, Inc.)
- Trading as a Business Workshop
- VectorVest 7 EOD
- VectorVest 7 RealTime/IntraDay
- VectorVest AutoTester
- VectorVest Educational Services
- VectorVest OnLine
- VectorVest Options Analyzer
- VectorVest ProGraphics v6.0
- VectorVest ProTrader 7
- VectorVest RealTime Derby Tool
- VectorVest Simulator
- VectorVest Variator
- VectorVest Watchdog
