HOT TOPICS LIST
- MACD
- Fibonacci
- RSI
- Gann
- ADXR
- Stochastics
- Volume
- Triangles
- Futures
- Cycles
- Volatility
- ZIGZAG
- MESA
- Retracement
- Aroon
INDICATORS LIST
LIST OF TOPICS
PRINT THIS ARTICLE
by Paolo Pezzutti
Although in the short term the rebound is likely to continue up to the 47.20 level, the current slowdown of the economy will have an impact on interest rates in the intermediate term.
Position: N/A
Paolo Pezzutti
Author of the book "Trading the US Markets - A Comprehensive Guide to US Markets for International Traders and Investors" - Harriman House (July 2008)
PRINT THIS ARTICLE
TECHNICAL ANALYSIS
CBOE 10-Year Treasury Note Rebounds
10/02/06 09:33:37 AMby Paolo Pezzutti
Although in the short term the rebound is likely to continue up to the 47.20 level, the current slowdown of the economy will have an impact on interest rates in the intermediate term.
Position: N/A
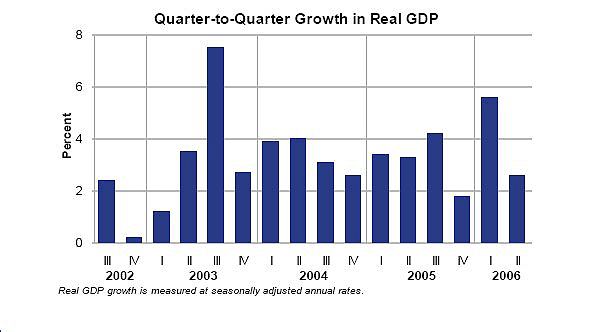
| The economic data released last week highlights a growth at an annual rate of 2.6% in the second quarter, a 0.3 percentage point less than in the preliminary estimates and 3.0 percentage points less than in the first quarter, according to the Bureau of Economic Analysis (BEA) (Figure 1). The anticipation provided by the markets regarding a slowdown of the economy are being confirmed by economic data. Lower commodity prices, housing, and 10-year interest rates are indicating the intermediate economic trend. At the same time, you can also observe how the smart money is shifting their focus toward the defensive sectors. The switching has been ongoing during the past four months, with benefits for the heath care, utilities, and the consumer staples sectors. Interestingly enough, however, after the May–June selloff, the technology sector developed a significant move very close to the April high. |

|
| FIGURE 1: GROWTH IN REAL GDP. Last week, data highlighted a GDP growth at an annual rate of 2.6% in the second quarter. |
| Graphic provided by: http://www.economicindicators.gov/. |
| |
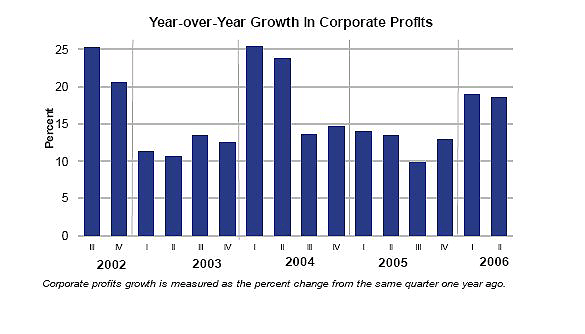
| Important indications come also from the corporate profits dynamics. In fact, second-quarter corporate profits grew 18.5% from the same quarter a year ago (Figure 2). Profits of financial corporations increased 29.6% and profits of nonfinancial corporations increased 10%. These figures indicate that corporations are still able to increase their profits at a good pace. I would expect, however, that the slowdown of the economy is somehow reflected also in decreasing corporate profits. For the moment, stock prices benefit from this environment of lower long-term interest rates and good profit dynamics. Data about inflation last week indicated that US core consumer price inflation hit an 11-year high in August as household incomes and spending rose at the slowest pace this year, the Commerce Department reported, providing some support in the short term to interest rates with the hint that the Fed could raise them yet again. |

|
| FIGURE 2: GROWTH IN CORPORATE PROFITS. Second-quarter corporate profits grew 18.5% from the same quarter a year ago. |
| Graphic provided by: http://www.economicindicators.gov/. |
| |
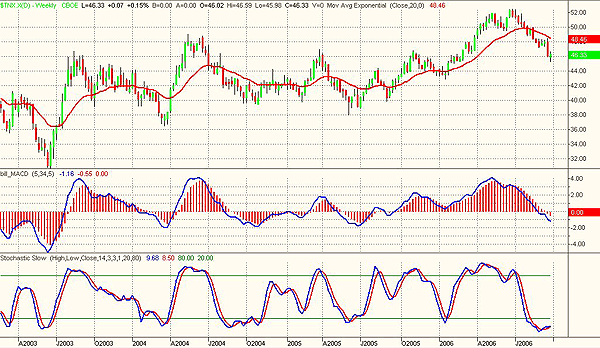
| From the technical perspective, the 10-Year Treasury note ($TNX) weekly chart in Figure 3 displays that $TNX has been developing a down leg since the end of June, bringing the moving average convergence/divergence (MACD) into negative values for the first time since 2005. In addition, the slow stochastic is oversold. The stochastic during the past three years has generally provided good trading indications when oversold and overbought. The trading environment, although with a positive drift, has been developing big swings favorable to the use of oscillators. Of course, you cannot be sure that what has worked well in the past is going to provide good results also in the future. The concept of ever-changing cycles makes it difficult to understand how long the current type of environment can last and most of all to realize with a limited delay that market conditions have changed. This is crucial for traders when they make use of indicators, because depending on the market phase, they have to select different tools and techniques. |

|
| FIGURE 3: $TNX, WEEKLY. Prices are developing a down leg. The stochastoc slow is now oversold. |
| Graphic provided by: TradeStation. |
| |
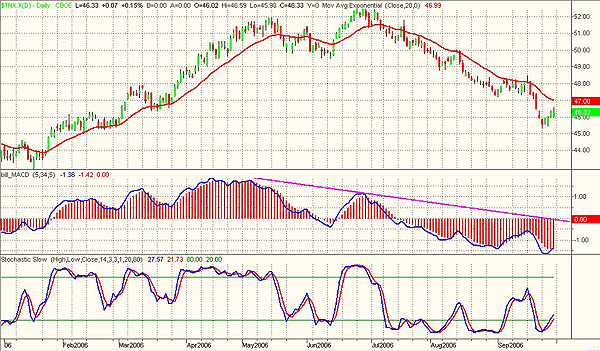
| At the daily level, in Figure 4, you can see that the negative MACD divergence printed last June has supported the beginning of the ongoing downtrend, bringing prices from a high of 52.45 printed on June 28 to the present 46.33. During the third week of September, in coincidence with the confirmation of the economy slowdown, prices accelerated to the downside printing a low at 45.30. The MACD confirmed the low of prices printing a new relative low. Interest rates, after the July through September selloff, now seem to have found some support provided by data released last week. Technically, the 10-year Treasury have started a rebound that could continue in the short term up to the resistance of 47.20. The slow stochastic, in fact, has turned up leaving the oversold area. A trading option would be to spot a low-risk entry point to the downside should prices print a short-term reversal close to the resistance levels. |

|
| FIGURE 4: $TNX, DAILY. At the end of the down move initiated last June, $TNX started a rebound that could continue in the short term. However, in the intermediate term, the situation remains negative for the moment. |
| Graphic provided by: TradeStation. |
| |
| Interest rates have anticipated a slowdown that, so far, has the characteristics of a soft landing. But it is too early to say, because the slowdown has still to show fully its effects. If the economy continues to show resistance in the next weeks, mainly in corporate profits, the interest rate rebound could continue for some time. Technically, in the intermediate term, I expect a retest of the 45.33 low and lower long-term interest rates. |
Author of the book "Trading the US Markets - A Comprehensive Guide to US Markets for International Traders and Investors" - Harriman House (July 2008)
| Address: | VIA ROBERTO AGO 26 POSTAL CODE 00166 |
| Rome, ITALY | |
| Phone # for sales: | +393357540708 |
| E-mail address: | pezzutti.paolo@tiscali.it |
Click here for more information about our publications!
Comments
Date: 10/03/06Rank: 4Comment:

Request Information From Our Sponsors
- StockCharts.com, Inc.
- Candle Patterns
- Candlestick Charting Explained
- Intermarket Technical Analysis
- John Murphy on Chart Analysis
- John Murphy's Chart Pattern Recognition
- John Murphy's Market Message
- MurphyExplainsMarketAnalysis-Intermarket Analysis
- MurphyExplainsMarketAnalysis-Visual Analysis
- StockCharts.com
- Technical Analysis of the Financial Markets
- The Visual Investor
- VectorVest, Inc.
- Executive Premier Workshop
- One-Day Options Course
- OptionsPro
- Retirement Income Workshop
- Sure-Fire Trading Systems (VectorVest, Inc.)
- Trading as a Business Workshop
- VectorVest 7 EOD
- VectorVest 7 RealTime/IntraDay
- VectorVest AutoTester
- VectorVest Educational Services
- VectorVest OnLine
- VectorVest Options Analyzer
- VectorVest ProGraphics v6.0
- VectorVest ProTrader 7
- VectorVest RealTime Derby Tool
- VectorVest Simulator
- VectorVest Variator
- VectorVest Watchdog
