HOT TOPICS LIST
- MACD
- Fibonacci
- RSI
- Gann
- ADXR
- Stochastics
- Volume
- Triangles
- Futures
- Cycles
- Volatility
- ZIGZAG
- MESA
- Retracement
- Aroon
INDICATORS LIST
LIST OF TOPICS
PRINT THIS ARTICLE
by Gary Grosschadl
Harmonic Inc. seems to have hit a wall at $7.75. If so, a correction may be overdue.
Position: Sell
Gary Grosschadl
Independent Canadian equities trader and technical analyst based in Peterborough
Ontario, Canada.
PRINT THIS ARTICLE
CHART ANALYSIS
Harmonic Inc. Hitting High Notes
10/02/06 08:52:31 AMby Gary Grosschadl
Harmonic Inc. seems to have hit a wall at $7.75. If so, a correction may be overdue.
Position: Sell
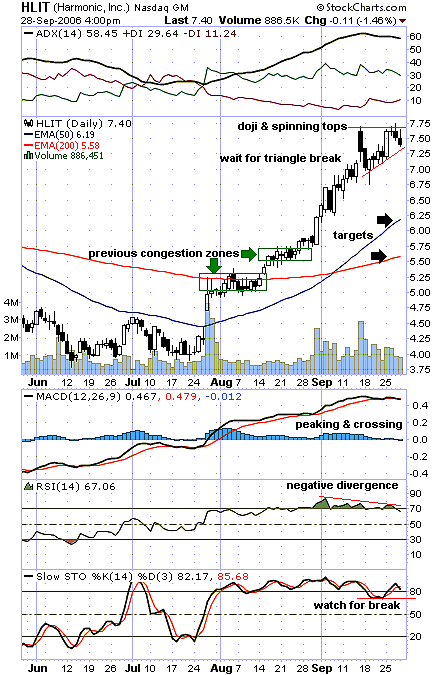
| Harmonic Inc. (HLIT) has been running hard since it gapped above its 200-day moving average. Now, candlesticks hint at a possible top and several indicators are signaling their own early warning. After an extended upleg, a doji candlestick (small cross) can mark a turning point or reversal. The matching open and close represents a stalemate between the bulls and bears. This can be a sign of upward momentum being lost. A spinning top candlestick with its small real body says much the same thing. |
| The next move becomes important as how this small ascending triangle is resolved, determining whether the bulls or bears assume control. A close above 7.70 (top trendline) would negate those warning candlesticks while a close below the slanted trendline likely signals a downleg (Figure 1). |

|
| FIGURE 1: HARMONIC, INC., DAILY. This chart shows a strong run for HLIT, but can it continue? |
| Graphic provided by: StockCharts.com. |
| |
| Note the two rectangle formations or congestion zones. They could come into play again as potential support levels should a bigger downleg occur. However, just above those congestion zones, two significant moving averages could also offer support. These are the 50-day exponential moving average (EMA), currently at 6.19, and the 200-day EMA at 5.58. |
| Several indicators are worth considering. The average directional movement index (ADX) shows an interesting history. Generally, when this line rises above both directional indicators (DIs), it is considered "overheated." A reversal is likely not very far off. In this case, it stayed overextended or overheated for a longer period. Now, this line appears to have peaked above 60 and now is starting to decline. This infers the bull move has peaked and a reversal could occur. |
| The moving average convergence/divergence (MACD) also appears to have peaked and is just starting to dip below its signal line. This is a potential sell signal for short-term traders. The relative strength index (RSI) shows its own concern a different way. Note the negative divergence to price action. As the stock price retested the previous high in the small triangle, the RSI clearly weakened. This often points to a coming downleg. The stochastic oscillator also shows, similar to the ADX line, that it has been in a overbought situation for an extended time. A move below 80 often signals a downturn. In this case, I would watch for a decline below previous support 70. Should a downturn develop, keep an eye on the downside targets mentioned as possible turning points. |
Independent Canadian equities trader and technical analyst based in Peterborough
Ontario, Canada.
| Website: | www.whatsonsale.ca/financial.html |
| E-mail address: | gwg7@sympatico.ca |
Click here for more information about our publications!
Comments
Date: 10/03/06Rank: 5Comment:

Request Information From Our Sponsors
- StockCharts.com, Inc.
- Candle Patterns
- Candlestick Charting Explained
- Intermarket Technical Analysis
- John Murphy on Chart Analysis
- John Murphy's Chart Pattern Recognition
- John Murphy's Market Message
- MurphyExplainsMarketAnalysis-Intermarket Analysis
- MurphyExplainsMarketAnalysis-Visual Analysis
- StockCharts.com
- Technical Analysis of the Financial Markets
- The Visual Investor
- VectorVest, Inc.
- Executive Premier Workshop
- One-Day Options Course
- OptionsPro
- Retirement Income Workshop
- Sure-Fire Trading Systems (VectorVest, Inc.)
- Trading as a Business Workshop
- VectorVest 7 EOD
- VectorVest 7 RealTime/IntraDay
- VectorVest AutoTester
- VectorVest Educational Services
- VectorVest OnLine
- VectorVest Options Analyzer
- VectorVest ProGraphics v6.0
- VectorVest ProTrader 7
- VectorVest RealTime Derby Tool
- VectorVest Simulator
- VectorVest Variator
- VectorVest Watchdog
