

HOT TOPICS LIST
- MACD
- Fibonacci
- RSI
- Gann
- ADXR
- Stochastics
- Volume
- Triangles
- Futures
- Cycles
- Volatility
- ZIGZAG
- MESA
- Retracement
- Aroon
INDICATORS LIST
LIST OF TOPICS
PRINT THIS ARTICLE
by David Penn
December gold features two key levels that will have to be exceeded before traders know which way is up ... or down.
Position: N/A
David Penn
Technical Writer for Technical Analysis of STOCKS & COMMODITIES magazine, Working-Money.com, and Traders.com Advantage.
PRINT THIS ARTICLE
SUPPORT & RESISTANCE
Between Support And Resistance
09/29/06 03:41:58 PMby David Penn
December gold features two key levels that will have to be exceeded before traders know which way is up ... or down.
Position: N/A
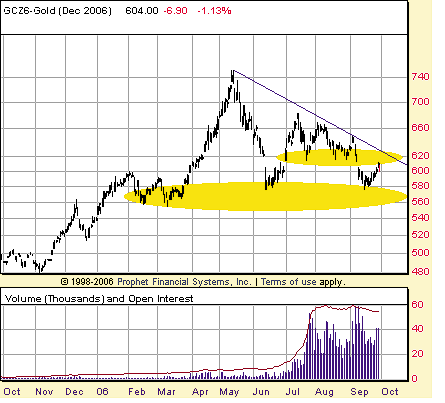
| While stock market junkies have petulantly badgered a market that, however fitfully, has been rising toward all-time highs (as least as far as the Dow Jones Industrial Average [DJIA] is concerned), true pity must be granted the gold bugs who saw their fortunes begin to rebound in midsummer, only to have those riches fizzle out into anxiety-inducing sideways movement. See Figure 1. |
|
| FIGURE 1: DECEMBER GOLD FUTURES, DAILY. The rally in gold that began in mid-June ran into a snag by July and began making a series of lower highs in each successive month. The downtrend line from the May peak has served effectively as resistance to every rally since the June bottom. |
| Graphic provided by: Prophet Financial, Inc. |
| |
| Unfortunately, the charts provide little immediate hope of relief from this agonizing sideways market. There is short- to intermediate-term resistance that has developed in the 600-620 range, resistance that is tied to the multiple gaps upward and downward including two such gaps in June and another in early September. Adding to the resistance to any upside move is the trendline shown in Figure 1 drawn from the May peak. This trendline connects that peak with the lowest high immediately before the lowest low in September to create another layer of resistance that is increasingly catching up with price action. In fact, right now it looks as if the gap-created resistance and the downtrend line resistance are likely to join forces as gold moves into October. |
| At the same time, there is abundant support between 580 and 560. The sources of this support are no less varied as the sources of resistance were. Here, the support is provided by the lows of February and March as well as the June lows. It is worth noting that the very first decline from the May peak found support at this level in June, and then after the uneven rebound in July and August, this support level was tested again in September. |
|
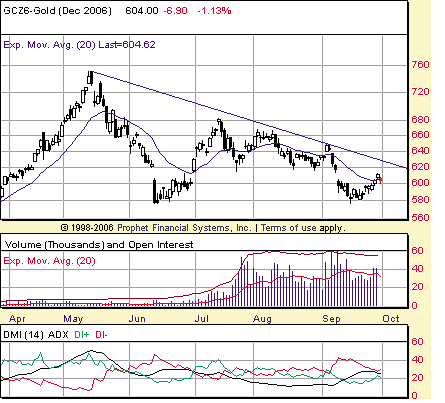
| FIGURE 2: DECEMBER GOLD FUTURES, DAILY. The ADX reflects some of the ambivalence reflected in the chart of December gold. Note how shortly after the DI- (in red) crossed over the DI+ (in green) in early September; the two lines look ready to cross back again (DI+ over DI-) late in the month. This is reminiscent of what happened in June. |
| Graphic provided by: Prophet Financial, Inc. |
| |
| Thus, there is a good chance that gold bugs won't get much resolution out of this Scylla/Charybdis gold market in the intermediate term. The average directional movement index (ADX), which hinted at a bearish resolution in early September, is decidedly less decisive in late September, with the red and green DI- and DI+ lines, respectively, initially diverging with the DI- on top, now converging with the DI+ line threatening to take the top position (Figure 2). In addition, the black ADX line, which crossed over the green DI+ line in midmonth, is of late rolling back over, suggesting that whatever trend it had initially indicated might be already proving false. |
| If there is one thing to abide by, it may remain that string of lower highs that has been in effect since the mild rally in late June and into early July. Often, when a trend is difficult to discern, I focus on whether the market is making lower highs or higher lows. While lower lows and higher highs are also indicative of a downtrend or an uptrend, a market with constant lows and a series of lower highs can still be seen as bearish rather than bullish, just as a market with constant highs but a series of higher lows can be seen as bullish rather than bearish. In fact, those markets just described characterize descending and ascending triangle formations. As such, until proven otherwise with a close that breaks the string of lower highs, the trend in gold remains downward. |
Technical Writer for Technical Analysis of STOCKS & COMMODITIES magazine, Working-Money.com, and Traders.com Advantage.
| Title: | Technical Writer |
| Company: | Technical Analysis, Inc. |
| Address: | 4757 California Avenue SW |
| Seattle, WA 98116 | |
| Phone # for sales: | 206 938 0570 |
| Fax: | 206 938 1307 |
| Website: | www.Traders.com |
| E-mail address: | DPenn@traders.com |
Traders' Resource Links | |
| Charting the Stock Market: The Wyckoff Method -- Books | |
| Working-Money.com -- Online Trading Services | |
| Traders.com Advantage -- Online Trading Services | |
| Technical Analysis of Stocks & Commodities -- Publications and Newsletters | |
| Working Money, at Working-Money.com -- Publications and Newsletters | |
| Traders.com Advantage -- Publications and Newsletters | |
| Professional Traders Starter Kit -- Software | |
Click here for more information about our publications!
Comments
Date:�09/30/06Rank:�3Comment:�

Request Information From Our Sponsors
- StockCharts.com, Inc.
- Candle Patterns
- Candlestick Charting Explained
- Intermarket Technical Analysis
- John Murphy on Chart Analysis
- John Murphy's Chart Pattern Recognition
- John Murphy's Market Message
- MurphyExplainsMarketAnalysis-Intermarket Analysis
- MurphyExplainsMarketAnalysis-Visual Analysis
- StockCharts.com
- Technical Analysis of the Financial Markets
- The Visual Investor
- VectorVest, Inc.
- Executive Premier Workshop
- One-Day Options Course
- OptionsPro
- Retirement Income Workshop
- Sure-Fire Trading Systems (VectorVest, Inc.)
- Trading as a Business Workshop
- VectorVest 7 EOD
- VectorVest 7 RealTime/IntraDay
- VectorVest AutoTester
- VectorVest Educational Services
- VectorVest OnLine
- VectorVest Options Analyzer
- VectorVest ProGraphics v6.0
- VectorVest ProTrader 7
- VectorVest RealTime Derby Tool
- VectorVest Simulator
- VectorVest Variator
- VectorVest Watchdog