HOT TOPICS LIST
- MACD
- Fibonacci
- RSI
- Gann
- ADXR
- Stochastics
- Volume
- Triangles
- Futures
- Cycles
- Volatility
- ZIGZAG
- MESA
- Retracement
- Aroon
INDICATORS LIST
LIST OF TOPICS
PRINT THIS ARTICLE
by David Penn
Cattle futures tumble toward a source of potential Fibonacci support.
Position: N/A
David Penn
Technical Writer for Technical Analysis of STOCKS & COMMODITIES magazine, Working-Money.com, and Traders.com Advantage.
PRINT THIS ARTICLE
RETRACEMENT
The Fall Of Feeder Cattle
09/29/06 02:31:17 PMby David Penn
Cattle futures tumble toward a source of potential Fibonacci support.
Position: N/A
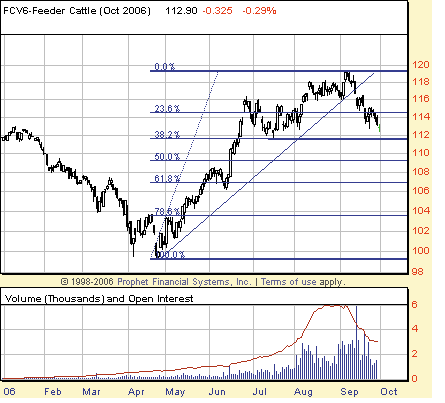
| One of the things you miss when you're focused on the possibility of the Dow Jones Industrial Average (DJIA) making new all-time highs are other markets that may be making impressive bull runs of their own. And since the spring of 2006, there have been few markets that have been as relentlessly bullish as the market for cattle. Although feeder cattle futures are shown here in Figure 1, the bull market in this group is virtually identical to the one in live cattle. |

|
| FIGURE 1: OCTOBER FEEDER CATTLE, DAILY. Breaking down beneath the multimonth trendline on increased volume, the October feeder cattle contract finds temporary support at the 38.2% Fibonacci retracement level before breaking down further for a test of the 50% retracement level. |
| Graphic provided by: Prophet Financial, Inc. |
| |
| A number of features are noteworthy about the April to September advance in cattle futures. The first is the trendline discipline. Drawing a trendline from the lowest low to the highest low immediately preceding the highest high, we find six, clear-cut trendline touches and several close calls. Even when the futures got ahead of themselves somewhat in the middle of the summer, the subsequent correction brought the futures right back in line with the trend. Trader Victor Sperandeo, whose trendline-drawing method I adhere to, suggests that his method of drawing trendlines is the closest you can get to approximating the slope from a linear regression. Cattle's "trendline discipline" seems to underscore that point. |
| As such, the break in the trendline in September was an event that traders should have taken quite seriously. Traders like Gary Kaltbaum warn against trying to pursue "wide and loose" patterns in the market, in part because the signals they give off can be misleading. By comparison, when a market that has been behaving in as orderly a fashion as cattle has begins to deviate by breaking down beneath a multimonth trendline on an increase in volume, speculators need to be able to convince themselves that a trend reversal is especially likely. |

|
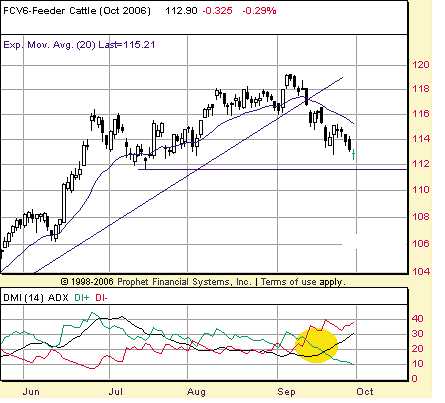
| FIGURE 2: OCTOBER FEEDER CATTLE, DAILY. The crossover of the bearish DI- line (in red) over the bullish DI+ line (in green) in early September comes almost simultaneously with the break of the uptrend line. The bearishness of that crossover is confirmed further as the ADX line (in black) crosses over the DI+ line later in the month. |
| Graphic provided by: Prophet Financial, Inc. |
| |
| The directional movement indicator shown in Figure 2 only emphasizes the validity of the trend change. Note that at precisely the same time the market is breaking down below the trendline, the bearish DI- line (in red) is crossing over the bullish DI+ line (in green). While this signal alone from the average directional movement index (ADX) can sometimes be misleading in choppy markets, causing traders to get whipped in and out of the market, the fact that this signal arrives in concert with the trendline break already mentioned gives greater validity to the change in trend. This change in trend is further confirmed when the ADX line (in black) crosses above the bullish DI+ line later in the month. |
| What's next for cattle futures? Even though the ADX is pointing to a new bearish trend, there is a reasonable chance that cattle futures will get some sort of bounce in early October. Mainly this is because there is potential support at the 50% retracement level near $1.12 (the July lows). Note that when October feeder cattle began its descent, it managed to find some temporary support at the higher 38.2% level in late September before breaking down again. Nevertheless, any bounce in cattle futures is likely to be shortable — particularly if it rallies into the 116–115 area bounded by the 20-day exponential moving average and the June highs. |
Technical Writer for Technical Analysis of STOCKS & COMMODITIES magazine, Working-Money.com, and Traders.com Advantage.
| Title: | Technical Writer |
| Company: | Technical Analysis, Inc. |
| Address: | 4757 California Avenue SW |
| Seattle, WA 98116 | |
| Phone # for sales: | 206 938 0570 |
| Fax: | 206 938 1307 |
| Website: | www.Traders.com |
| E-mail address: | DPenn@traders.com |
Traders' Resource Links | |
| Charting the Stock Market: The Wyckoff Method -- Books | |
| Working-Money.com -- Online Trading Services | |
| Traders.com Advantage -- Online Trading Services | |
| Technical Analysis of Stocks & Commodities -- Publications and Newsletters | |
| Working Money, at Working-Money.com -- Publications and Newsletters | |
| Traders.com Advantage -- Publications and Newsletters | |
| Professional Traders Starter Kit -- Software | |
Click here for more information about our publications!
Comments
Date: 09/30/06Rank: 2Comment:

Request Information From Our Sponsors
- StockCharts.com, Inc.
- Candle Patterns
- Candlestick Charting Explained
- Intermarket Technical Analysis
- John Murphy on Chart Analysis
- John Murphy's Chart Pattern Recognition
- John Murphy's Market Message
- MurphyExplainsMarketAnalysis-Intermarket Analysis
- MurphyExplainsMarketAnalysis-Visual Analysis
- StockCharts.com
- Technical Analysis of the Financial Markets
- The Visual Investor
- VectorVest, Inc.
- Executive Premier Workshop
- One-Day Options Course
- OptionsPro
- Retirement Income Workshop
- Sure-Fire Trading Systems (VectorVest, Inc.)
- Trading as a Business Workshop
- VectorVest 7 EOD
- VectorVest 7 RealTime/IntraDay
- VectorVest AutoTester
- VectorVest Educational Services
- VectorVest OnLine
- VectorVest Options Analyzer
- VectorVest ProGraphics v6.0
- VectorVest ProTrader 7
- VectorVest RealTime Derby Tool
- VectorVest Simulator
- VectorVest Variator
- VectorVest Watchdog
