HOT TOPICS LIST
- MACD
- Fibonacci
- RSI
- Gann
- ADXR
- Stochastics
- Volume
- Triangles
- Futures
- Cycles
- Volatility
- ZIGZAG
- MESA
- Retracement
- Aroon
INDICATORS LIST
LIST OF TOPICS
PRINT THIS ARTICLE
by Han Kim
Is the current trend ready to end? Momentum is a good indicator to use for spotting possible trend reversals.
Position: N/A
Han Kim
Traders.com Advantage Staff Writer
PRINT THIS ARTICLE
REVERSAL
Feeling the Momentum
10/09/00 11:25:38 AMby Han Kim
Is the current trend ready to end? Momentum is a good indicator to use for spotting possible trend reversals.
Position: N/A
| Sportscasters often say that they can feel the "momentum" changing in a game and often the score reflects the momentum swings. Such a momentum exists in the market. Momentum in the market is a measure of the price change in a given period of time. Quite often, momentum is confirmed by subsequent price movement. As such, it can be used as a leading indicator. |
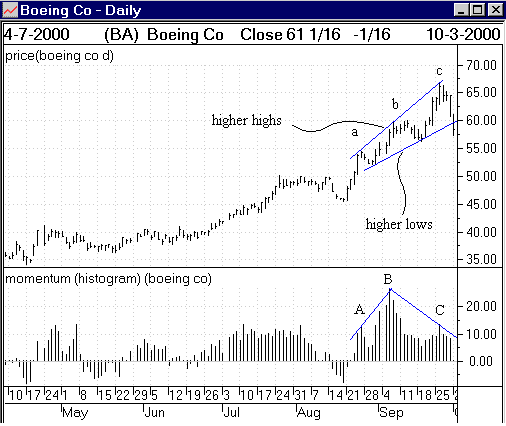
| To recognize such a reversal, take a look at Boeing Company [BA]. Below in Figure 1, is a bar chart of BA with the trendlines and key points labeled. The 12-bar momentum indicator is in the lower part of the figure. Notice that the momentum has peaked at point B and is declining while the prices are still making higher highs as shown by the trendline connecting points a, b and c. The momentum is signaling a possible reversal which can be seen by the reversal in the trend from A to B and B to C. On 10/3/00 the price had just fallen below the trendline for higher lows, marking the possible end of the current trend. If the price does not move well above the trend of higher lows today, the reversal signal of the momentum is confirmed by the price. |

|
| Figure 1. Boeing Company [BA] shows signs of a reversal. Higher highs and higher lows are currently in an uptrend. However, the momentum indicator is showing signs that uptrend is ending. |
| Graphic provided by: Windowonwallstreet.com. |
| |
Traders.com Advantage Staff Writer
| Title: | Webmaster |
| Company: | Technical Analysis, Inc. |
| Address: | 4757 California AVE SW |
| Seattle, WA 98116 | |
| Phone # for sales: | 206-938-0570 |
| Fax: | 206-938-1307 |
| Website: | www.traders.com |
| E-mail address: | hkim@traders.com |
Traders' Resource Links | |
| Charting the Stock Market: The Wyckoff Method -- Books | |
| Working-Money.com -- Online Trading Services | |
| Traders.com Advantage -- Online Trading Services | |
| Technical Analysis of Stocks & Commodities -- Publications and Newsletters | |
| Working Money, at Working-Money.com -- Publications and Newsletters | |
| Traders.com Advantage -- Publications and Newsletters | |
| Professional Traders Starter Kit -- Software | |
Click here for more information about our publications!
Comments
Date: / /Rank: 5Comment: Thanks Han. I ve been thinking I better get out of BA. The question is where. This article is worth at least several thousand dollars.
Date: / /Rank: Comment: http://www.ruttiger.com/sponsors
Date: / /Rank: 2Comment:
Date: / /Rank: 4Comment:

Request Information From Our Sponsors
- VectorVest, Inc.
- Executive Premier Workshop
- One-Day Options Course
- OptionsPro
- Retirement Income Workshop
- Sure-Fire Trading Systems (VectorVest, Inc.)
- Trading as a Business Workshop
- VectorVest 7 EOD
- VectorVest 7 RealTime/IntraDay
- VectorVest AutoTester
- VectorVest Educational Services
- VectorVest OnLine
- VectorVest Options Analyzer
- VectorVest ProGraphics v6.0
- VectorVest ProTrader 7
- VectorVest RealTime Derby Tool
- VectorVest Simulator
- VectorVest Variator
- VectorVest Watchdog
- StockCharts.com, Inc.
- Candle Patterns
- Candlestick Charting Explained
- Intermarket Technical Analysis
- John Murphy on Chart Analysis
- John Murphy's Chart Pattern Recognition
- John Murphy's Market Message
- MurphyExplainsMarketAnalysis-Intermarket Analysis
- MurphyExplainsMarketAnalysis-Visual Analysis
- StockCharts.com
- Technical Analysis of the Financial Markets
- The Visual Investor
