HOT TOPICS LIST
- MACD
- Fibonacci
- RSI
- Gann
- ADXR
- Stochastics
- Volume
- Triangles
- Futures
- Cycles
- Volatility
- ZIGZAG
- MESA
- Retracement
- Aroon
INDICATORS LIST
LIST OF TOPICS
PRINT THIS ARTICLE
by Koos van der Merwe
Why has the price of this stock, a designer, developer, manufacturer and marketer of custom and open-standard memory solutions, jumped?
Position: Buy
Koos van der Merwe
Has been a technical analyst since 1969, and has worked as a futures and options trader with First Financial Futures in Johannesburg, South Africa.
PRINT THIS ARTICLE
CYCLES
SimpleTech A Stock To Watch
09/29/06 12:59:35 PMby Koos van der Merwe
Why has the price of this stock, a designer, developer, manufacturer and marketer of custom and open-standard memory solutions, jumped?
Position: Buy
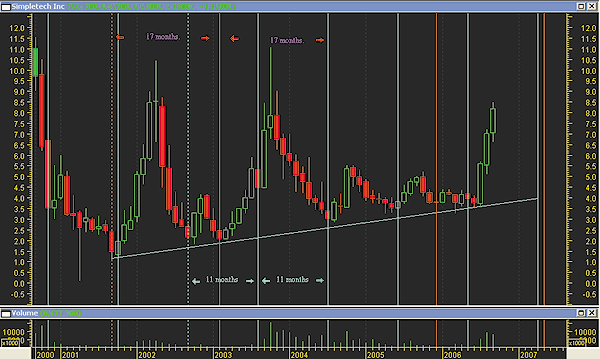
| Why has the price of SimpleTech, Inc. (STEC), jumped from $3.65 to $8.43 by September 22? Could we have seen this looking at a monthly chart (Figure 1)? Figure 1 shows a cyclical pattern that looks very predictive. There are two monthly cycles, an 11-month cycle and a 17-month cycle. Why? What happened every 11 months that caused the price to break out decisively every 17 months? Running a cycle finder across the highs did not show anything. I looked through news items to see if there was an inkling, but again there was nothing obvious among the numerous news reports presented other than their financials, which on occasion beat expectations. |

|
| FIGURE 1: SIMPLETECH, MONTHLY. This chart of STEC shows cycles. |
| Graphic provided by: MetaStock. |
| |
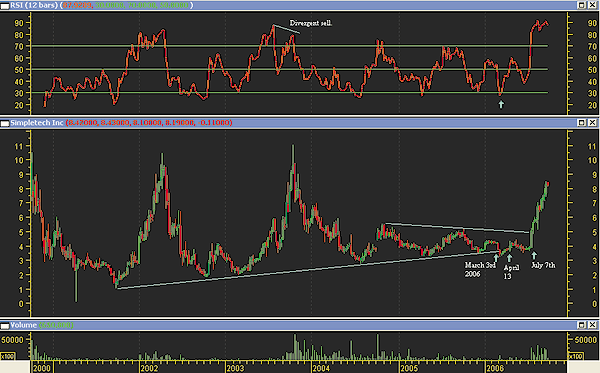
| Figure 2 is a weekly chart with a nine-period relative strength index (RSI). The indicator was very successful in calling buy & sell signals. A support line was broken in March 2006, suggesting weakness ahead, but this proved to be a false signal. Volume prior to the week ended July 7 also gave no indication of the breakout upward. The RSI was the only inkling that the price might start moving upward, but then in the 10 weeks following that signal, the price actually moved below the entry price. This was discouraging. To try and define an exact entry point, I therefore looked at the daily chart. |

|
| FIGURE 2: SIMPLETECH, WEEKLY. This chart of STEC shows buy signals based on the RSI. |
| Graphic provided by: MetaStock. |
| |
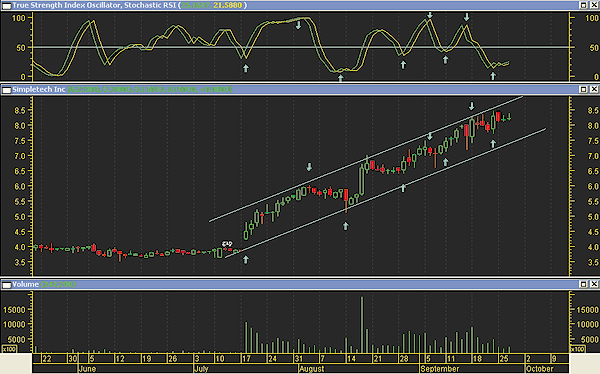
| With Figure 3, the daily chart, I used the stochastic RSI, as this gave me the best clues out of all the indicators available on MetaStock. I have highlighted the buy & sell signals. Note that the sudden rise on a gap was not forecast by volume. Volume only moved up strongly on the day the price rose on a gap. If the cycle on the monthly chart is correct and the cycle pattern is maintained, then STEC should be close to a high and start falling into a cyclical low by May 2007. |

|
| FIGURE 3: SIMPLETECH, DAILY. This chart of STEC shows a sudden unexpected rise on a gap. |
| Graphic provided by: MetaStock. |
| |
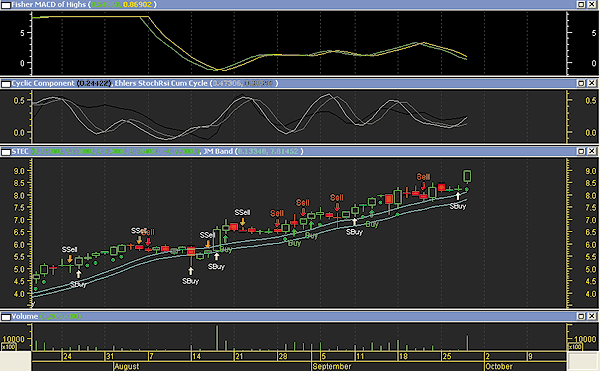
| Short-term intraday traders could trade the stock. My final chart, Figure 4, is another daily chart showing three indicators that suggest the share could be bought for the short term. The indicators are as follows: 1. A Fisher transform of the moving average convergence/divergence (MACD) of highs 2. The stochastic RSI of the cumulative cycle as outlined by John Ehlers 3. A JM internal band (15-period simple moving average offset by 2%). A move above the upper band is a buy signal, and as long as the share price remains above the upper band, we can hold. A sell signal is triggered by a move below the lower band. This is definitely a share to watch. |

|
| FIGURE 4: SIMPLETECH, DAILY, SHORT TERM. This short-term chart of STEC shows three preferable indicators. |
| Graphic provided by: MetaStock. |
| |
Has been a technical analyst since 1969, and has worked as a futures and options trader with First Financial Futures in Johannesburg, South Africa.
| Address: | 3256 West 24th Ave |
| Vancouver, BC | |
| Phone # for sales: | 6042634214 |
| E-mail address: | petroosp@gmail.com |
Click here for more information about our publications!
Comments
Date: 09/30/06Rank: 3Comment:

Request Information From Our Sponsors
- StockCharts.com, Inc.
- Candle Patterns
- Candlestick Charting Explained
- Intermarket Technical Analysis
- John Murphy on Chart Analysis
- John Murphy's Chart Pattern Recognition
- John Murphy's Market Message
- MurphyExplainsMarketAnalysis-Intermarket Analysis
- MurphyExplainsMarketAnalysis-Visual Analysis
- StockCharts.com
- Technical Analysis of the Financial Markets
- The Visual Investor
- VectorVest, Inc.
- Executive Premier Workshop
- One-Day Options Course
- OptionsPro
- Retirement Income Workshop
- Sure-Fire Trading Systems (VectorVest, Inc.)
- Trading as a Business Workshop
- VectorVest 7 EOD
- VectorVest 7 RealTime/IntraDay
- VectorVest AutoTester
- VectorVest Educational Services
- VectorVest OnLine
- VectorVest Options Analyzer
- VectorVest ProGraphics v6.0
- VectorVest ProTrader 7
- VectorVest RealTime Derby Tool
- VectorVest Simulator
- VectorVest Variator
- VectorVest Watchdog
