HOT TOPICS LIST
- MACD
- Fibonacci
- RSI
- Gann
- ADXR
- Stochastics
- Volume
- Triangles
- Futures
- Cycles
- Volatility
- ZIGZAG
- MESA
- Retracement
- Aroon
INDICATORS LIST
LIST OF TOPICS
PRINT THIS ARTICLE
by David Penn
Are airlines stocks getting a bid?
Position: N/A
David Penn
Technical Writer for Technical Analysis of STOCKS & COMMODITIES magazine, Working-Money.com, and Traders.com Advantage.
PRINT THIS ARTICLE
SECTOR INVESTING
Cleared For Takeoff?
09/27/06 09:58:03 AMby David Penn
Are airlines stocks getting a bid?
Position: N/A
| A rising tide lifts all boats ... and the bright sun of the business cycle sooner or later shines on all sectors. Or so it seems. Back in early August, I suggested that airlines stocks were bottoming ("A 2B Bottom In Airlines," Traders.com Advantage, August 10, 2006). As they say in the business, that call wasn't too bad at all. The day after that article appeared, the AMEX Airlines index ($XAL) made its low and fitfully, haltingly, has moved higher ever since. |

|
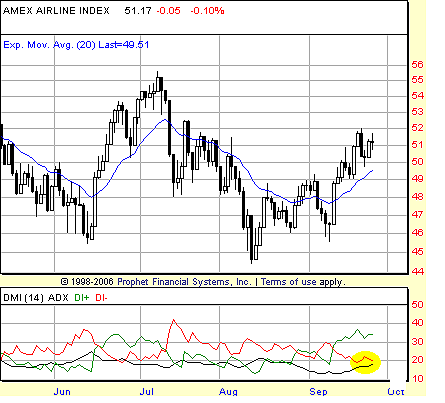
| FIGURE 1: AMEX AIRLINES INDEX, DAILY. Note how the DMI line (in black) is coming up from a particularly low level and threatening a crossover of the bearish DI- line (in red). A crossover and continued movement upward in the DMI would confirm the rally in this group. |
| Graphic provided by: Prophet Financial, Inc. |
| |
| I've been paying particularly close attention to sector rotation since spring, when I wrote about the emergence of the consumer staples stocks for Working-Money.com ("Counting On Consumers," May 1, 2006). Since then, we've seen utilities stocks ramp higher, energy stocks suffer, and then the broader market — along with the financials, technology, and consumer cyclicals/discretionary — bottom and ramp higher, sharply so in some instances. The rally in airlines stocks — especially the breakout occurring in mid-September — seems to underscore this rotation through the business cycle insofar as transportation stocks tend to begin moving up once other "early expansion" sectors, such as technology, have already begun to do so. |
| I mentioned recently how I have been using the directional movement index/average directional movement index (DMI/ADX) when doing sector scans. The idea behind this is that the DMI/ADX can be an effective trend confirmation indicator. When looking through the various sector indexes and exchange traded funds (ETFs), I look for instances when the ADX is at a low level and is curling up to intersect and cross over either the bullish DI+ line or the bearish DI- line. When the ADX crosses over a falling bullish line, it often signals the beginning of a new bearish trend. When the ADX crosses over a falling bearish line, a new bullish trend is often in the making. Here, we see that the ADX (in black, Figure 1) has not yet crossed over the bearish DI- line (in red), but appears very much ready to. This is one of the things I am observing as I watch the $XAL. |

|
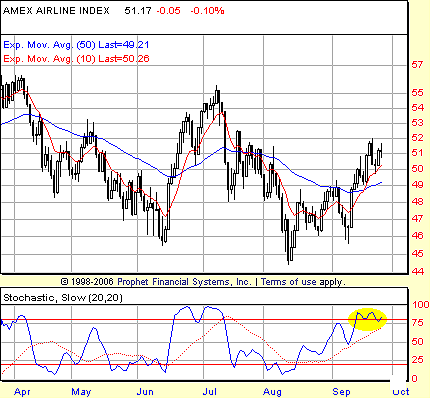
| FIGURE 2: AMEX AIRLINES INDEX, DAILY. Moving into overbought territory in the second half of September, the $XAL provides a clue for momentum traders that further upside remains a distinct possibility. |
| Graphic provided by: Prophet Financial, Inc. |
| |
| From a trading perspective, the index may already be a buy. As Figure 2 shows, the $XAL moved into overbought territory in mid-September. While many see such developments as a warning to avoid new long positions, others have pointed out that overbought markets often become even more overbought as they continue to move higher. This was one of the interesting highlights in a seminar presented by Price Headley (bigtrends.com) a year ago at the Trader's Expo in Chicago. As such, as long as this market remains overbought — based on the above 80 reading in the stochastic — a speculator can feel relatively comfortable about riding the market higher. Ironically, per this approach, it is when the market is no longer overbought (that is, the stochastic falling back below 80) that a trader on the long side need be cautious. |
| Another place to watch would likely be the oil stocks. Recent price action in this group has some thinking that oil stocks (and, by extension, others in the commodities business) may have bottomed. Insofar as it is difficult to imagine a scenario in which oil prices and oil stocks were advancing at the same times as the airlines group, it will be worth noting to see if the move higher in oil stocks is sustained and, if so, how that affects what increasingly appears to be a true turnaround in the fortunes of airlines stocks. |
Technical Writer for Technical Analysis of STOCKS & COMMODITIES magazine, Working-Money.com, and Traders.com Advantage.
| Title: | Technical Writer |
| Company: | Technical Analysis, Inc. |
| Address: | 4757 California Avenue SW |
| Seattle, WA 98116 | |
| Phone # for sales: | 206 938 0570 |
| Fax: | 206 938 1307 |
| Website: | www.Traders.com |
| E-mail address: | DPenn@traders.com |
Traders' Resource Links | |
| Charting the Stock Market: The Wyckoff Method -- Books | |
| Working-Money.com -- Online Trading Services | |
| Traders.com Advantage -- Online Trading Services | |
| Technical Analysis of Stocks & Commodities -- Publications and Newsletters | |
| Working Money, at Working-Money.com -- Publications and Newsletters | |
| Traders.com Advantage -- Publications and Newsletters | |
| Professional Traders Starter Kit -- Software | |
Click here for more information about our publications!
Comments
Date: 09/27/06Rank: 3Comment:

Request Information From Our Sponsors
- StockCharts.com, Inc.
- Candle Patterns
- Candlestick Charting Explained
- Intermarket Technical Analysis
- John Murphy on Chart Analysis
- John Murphy's Chart Pattern Recognition
- John Murphy's Market Message
- MurphyExplainsMarketAnalysis-Intermarket Analysis
- MurphyExplainsMarketAnalysis-Visual Analysis
- StockCharts.com
- Technical Analysis of the Financial Markets
- The Visual Investor
- VectorVest, Inc.
- Executive Premier Workshop
- One-Day Options Course
- OptionsPro
- Retirement Income Workshop
- Sure-Fire Trading Systems (VectorVest, Inc.)
- Trading as a Business Workshop
- VectorVest 7 EOD
- VectorVest 7 RealTime/IntraDay
- VectorVest AutoTester
- VectorVest Educational Services
- VectorVest OnLine
- VectorVest Options Analyzer
- VectorVest ProGraphics v6.0
- VectorVest ProTrader 7
- VectorVest RealTime Derby Tool
- VectorVest Simulator
- VectorVest Variator
- VectorVest Watchdog
