

HOT TOPICS LIST
- MACD
- Fibonacci
- RSI
- Gann
- ADXR
- Stochastics
- Volume
- Triangles
- Futures
- Cycles
- Volatility
- ZIGZAG
- MESA
- Retracement
- Aroon
INDICATORS LIST
LIST OF TOPICS
PRINT THIS ARTICLE
by Arthur Hill
DELL firmed over the last two months, and a recent rise in the accumulation-distribution line shows signs of accumulation.
Position: Accumulate
Arthur Hill
Arthur Hill is currently editor of TDTrader.com, a website specializing in trading strategies, sector/industry specific breadth stats and overall technical analysis. He passed the Society of Technical Analysts (STA London) diploma exam with distinction is a Certified Financial Technician (CFTe). Prior to TD Trader, he was the Chief Technical Analyst for Stockcharts.com and the main contributor to the ChartSchool.
PRINT THIS ARTICLE
ACCUM./DIST. CHAIKIN
Dell Tries To Bottom
09/26/06 01:18:09 PMby Arthur Hill
DELL firmed over the last two months, and a recent rise in the accumulation-distribution line shows signs of accumulation.
Position: Accumulate
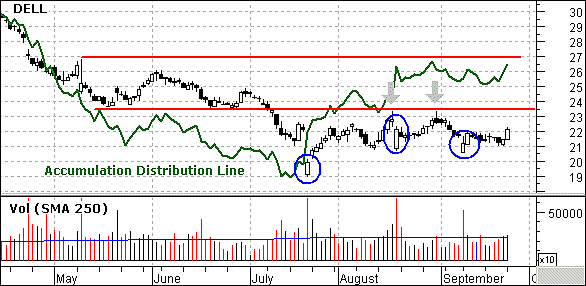
| DELL fell on hard times over the last 18 months as the stock declined from the low 40s to around 19 in July (Figure 1). The July low occurred with a gap down and high volume. Despite this gap down, DELL firmed that very day and filled the gap over the next few weeks. The ability to fill the gap is positive, but DELL ran smack into resistance from broken support and moved into a trading range. |
|
| FIGURE 1: DELL. Dell moved into a trading range after the stock ran into resistance. |
| Graphic provided by: MetaStock. |
| Graphic provided by: TeleChart Data. |
| |
| The stock has consolidated between 19 and 23.5 since mid-July, showing signs of stabilization. As noted previously, the stock broke support at 23.5 in July and this level turned into resistance twice in August (gray arrows). The first step to a reversal is a breakout, and DELL needs to reclaim the support break at 23.5 before we can take the bulls seriously. |
| A look inside the consolidation can help decide if the stock is going to break higher or continue lower. There are three high-volume down days in each of the last three months (red volume-bars). Even though the stock closed lower on the day, white candlesticks formed and buyers were active. The white candlestick shows that the stock opened near the low and closed near the high (blue ovals). The stock advanced during the day, even though it closed below the prior close. |
| This candlestick action shows signs of accumulation and this is reflected in the accumulation-distribution line. In contrast to on-balance volume, the A-D line ignores the close-to-close change and focuses on the open-to-close price action. The A-D line moves higher when a stock closes above the midpoint of its high-low and moves lower when it closes below. The A-D line bottomed in mid-July and moved higher over the last nine weeks. This shows signs of accumulation and increases the chances of a resistance break at 23.5. I am marking key support at 20 and a break below this level would make DELL a teenager. |
Arthur Hill is currently editor of TDTrader.com, a website specializing in trading strategies, sector/industry specific breadth stats and overall technical analysis. He passed the Society of Technical Analysts (STA London) diploma exam with distinction is a Certified Financial Technician (CFTe). Prior to TD Trader, he was the Chief Technical Analyst for Stockcharts.com and the main contributor to the ChartSchool.
| Title: | Editor |
| Company: | TDTrader.com |
| Address: | Willem Geetsstraat 17 |
| Mechelen, B2800 | |
| Phone # for sales: | 3215345465 |
| Website: | www.tdtrader.com |
| E-mail address: | arthurh@tdtrader.com |
Traders' Resource Links | |
| TDTrader.com has not added any product or service information to TRADERS' RESOURCE. | |
Click here for more information about our publications!
Comments
Date:�09/27/06Rank:�4Comment:�

Request Information From Our Sponsors
- VectorVest, Inc.
- Executive Premier Workshop
- One-Day Options Course
- OptionsPro
- Retirement Income Workshop
- Sure-Fire Trading Systems (VectorVest, Inc.)
- Trading as a Business Workshop
- VectorVest 7 EOD
- VectorVest 7 RealTime/IntraDay
- VectorVest AutoTester
- VectorVest Educational Services
- VectorVest OnLine
- VectorVest Options Analyzer
- VectorVest ProGraphics v6.0
- VectorVest ProTrader 7
- VectorVest RealTime Derby Tool
- VectorVest Simulator
- VectorVest Variator
- VectorVest Watchdog
- StockCharts.com, Inc.
- Candle Patterns
- Candlestick Charting Explained
- Intermarket Technical Analysis
- John Murphy on Chart Analysis
- John Murphy's Chart Pattern Recognition
- John Murphy's Market Message
- MurphyExplainsMarketAnalysis-Intermarket Analysis
- MurphyExplainsMarketAnalysis-Visual Analysis
- StockCharts.com
- Technical Analysis of the Financial Markets
- The Visual Investor