

HOT TOPICS LIST
- MACD
- Fibonacci
- RSI
- Gann
- ADXR
- Stochastics
- Volume
- Triangles
- Futures
- Cycles
- Volatility
- ZIGZAG
- MESA
- Retracement
- Aroon
INDICATORS LIST
LIST OF TOPICS
PRINT THIS ARTICLE
by Gary Grosschadl
The Coca-Cola Bottling Co. stock price has been above $60 less than a handful times since 1997.
Recently it spiked that high again, but now that threshold has fizzed. Was this a top?
Position: Sell
Gary Grosschadl
Independent Canadian equities trader and technical analyst based in Peterborough
Ontario, Canada.
PRINT THIS ARTICLE
DOUBLE TOPS
Coke Topping Out?
09/26/06 09:14:26 AMby Gary Grosschadl
The Coca-Cola Bottling Co. stock price has been above $60 less than a handful times since 1997.
Recently it spiked that high again, but now that threshold has fizzed. Was this a top?
Position: Sell
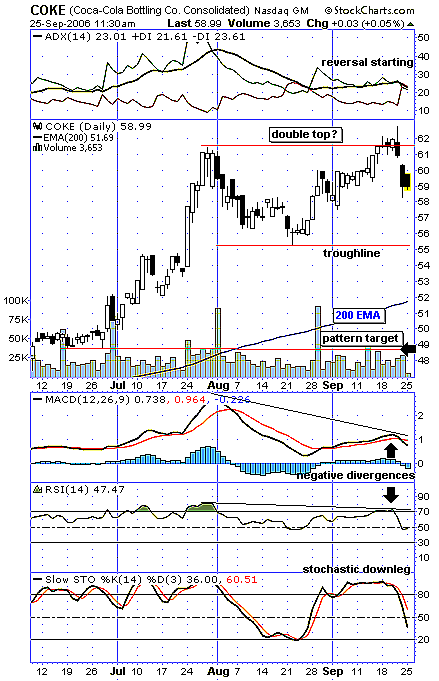
| Figure 1, a daily chart for COKE, suggests a double top may be in the making. The symmetry looks good for this pattern; note the doji bottom marking the troughline. A few trading days ago, the bullish thrust above $62 was beaten back to close near the low of the day. This weakness, emphasized by the long upper shadow, was confirmed the next day with a gap down and another bearish close. |
| This action suggests that a troughline test of support is likely. A double top technically is not official until the formation closes below that trendline. This would bring into focus the downside fulfillment target near $49, roughly the upside measure from troughline to top, as applied to the downside break. Another possibility is support from the 200-day exponential moving average (EMA) currently at 51.69. |
|
| FIGURE 1: COKE, DAILY. This chart of COKE suggests the fizz may be flattening via a possible double top. |
| Graphic provided by: StockCharts.com. |
| |
| Several indicators are worth commenting on. At the top of the chart a bearish reversal is starting via the positive and negative directional indicators (+DI/-DI). When the red line of -DI rides above +DI, the bears are deemed to have the upper hand. The most striking indicator is the moving average convergence/divergence (MACD). Note the very large negative divergence to price action. As the second peak was hit, this indicator fell far short of doing the same. This hints at a coming downturn. The relative strength indicator (RSI) shows its own divergence, albeit much smaller. The stochastic oscillator clearly shows a downleg under way. |
| In summary, there are three downside targets: a troughline test near $55 (support here averts a double top formation), possible support near the 200-day EMA, and the pattern target near $49. |
Independent Canadian equities trader and technical analyst based in Peterborough
Ontario, Canada.
| Website: | www.whatsonsale.ca/financial.html |
| E-mail address: | gwg7@sympatico.ca |
Click here for more information about our publications!
Comments
Date:�09/26/06Rank:�5Comment:�

Request Information From Our Sponsors
- StockCharts.com, Inc.
- Candle Patterns
- Candlestick Charting Explained
- Intermarket Technical Analysis
- John Murphy on Chart Analysis
- John Murphy's Chart Pattern Recognition
- John Murphy's Market Message
- MurphyExplainsMarketAnalysis-Intermarket Analysis
- MurphyExplainsMarketAnalysis-Visual Analysis
- StockCharts.com
- Technical Analysis of the Financial Markets
- The Visual Investor
- VectorVest, Inc.
- Executive Premier Workshop
- One-Day Options Course
- OptionsPro
- Retirement Income Workshop
- Sure-Fire Trading Systems (VectorVest, Inc.)
- Trading as a Business Workshop
- VectorVest 7 EOD
- VectorVest 7 RealTime/IntraDay
- VectorVest AutoTester
- VectorVest Educational Services
- VectorVest OnLine
- VectorVest Options Analyzer
- VectorVest ProGraphics v6.0
- VectorVest ProTrader 7
- VectorVest RealTime Derby Tool
- VectorVest Simulator
- VectorVest Variator
- VectorVest Watchdog