HOT TOPICS LIST
- MACD
- Fibonacci
- RSI
- Gann
- ADXR
- Stochastics
- Volume
- Triangles
- Futures
- Cycles
- Volatility
- ZIGZAG
- MESA
- Retracement
- Aroon
INDICATORS LIST
LIST OF TOPICS
PRINT THIS ARTICLE
by David Penn
Signs of a breakout in brokerage stocks can only be good for stocks.
Position: N/A
David Penn
Technical Writer for Technical Analysis of STOCKS & COMMODITIES magazine, Working-Money.com, and Traders.com Advantage.
PRINT THIS ARTICLE
BREAKOUTS
Brokers Break Out
09/26/06 08:35:36 AMby David Penn
Signs of a breakout in brokerage stocks can only be good for stocks.
Position: N/A
| There is a throwaway line in Marty Schwartz's autobiography, Pit Bull, in which he talks about switching from options on oil stocks to options on brokerage stocks once the bear market ended for good with the 1982 recession. Schwartz's object of affection was call options on Merrill Lynch. The thinking was that if people were going to have to start buying stocks — and they would after 10 years of endlessly seesawing prices in the 1970s — then they were going to have to start doing business with brokers again. |

|
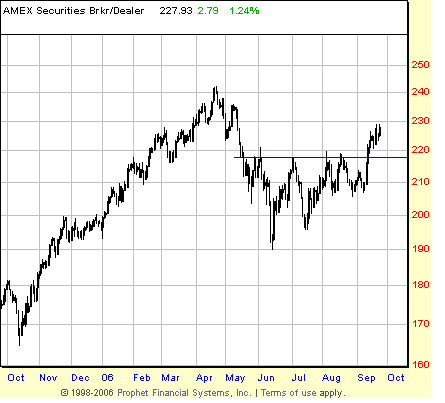
| FIGURE 1: AMEX SECURITIES BROKER/DEALER INDEX, DAILY. This triangular base in the brokerage stocks strongly suggests a rally that will exceed the spring 2006 highs. |
| Graphic provided by: Prophet Financial, Inc. |
| |
| The brokers have always been a good tell on the health of a financially mature economy (Figure 1). While financial stocks — regional and money center banks — generally are among the outperformers in a new bull market, brokerage stocks are particularly placed near the "sweet spot" in both the business cycle and the economy. I caught onto brokerage stocks as a possible opportunity while doing an average directional movement index (ADX) screen on a watchlist of major sector indexes. |
| Because the ADX can help determine whether a trend is building, I thought using it as a screen would be a helpful way of determining which sectors were emerging and which were fading. I used Price Headley's method from his book Big Trends In Trading, a method I recently discussed in an article for Working Money, "What's In A Trend?" (September 12, 2006). This method, at root, comes down to Headley's observation that "in a new bullish trend, ADX should cross over the -DM line for a new buy signal." New sell signals, on the other hand, would be triggered by an ADX cross over the +DM line. |

|
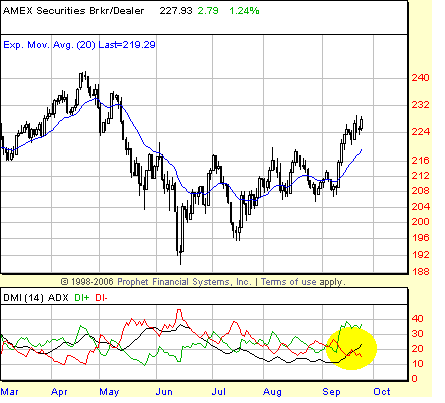
| FIGURE 2: AMEX SECURITIES BROKER/DEALER INDEX, DAILY. When the ADX is rising from a low level (near or below 20, according to Headley) and crosses above the -DI line (in red), a new bullish trend is often in the works. |
| Graphic provided by: Prophet Financial, Inc. |
| |
| Figure 2 shows the broker's index, $XBD, with the DMI/ADX indicator. The highlighted section of the indicator shows how the ADX (in black) had been below the 20 level since mid-July. As the index moved up and out in September, the ADX bottomed and also began moving higher, crossing over the bearish DI- line (in red) by mid-September. This crossover coincided with the $XBD's breakout above the highs of August, July, and June, with the next resistance at the May highs near 235. |
| What is the likelihood that the $XBD will move up to surpass those May highs and perhaps even the April highs just north of 240? If we treat the triangular consolidation/bottom in the $XBD from June to September as an ascending triangle bottom and the mid-September rally as its breakout, then it could be argued that the formation size of some 24-odd points and a breakout level of 216 could provide for a minimum upside to 240 — and a serious test of those April highs. |
Technical Writer for Technical Analysis of STOCKS & COMMODITIES magazine, Working-Money.com, and Traders.com Advantage.
| Title: | Technical Writer |
| Company: | Technical Analysis, Inc. |
| Address: | 4757 California Avenue SW |
| Seattle, WA 98116 | |
| Phone # for sales: | 206 938 0570 |
| Fax: | 206 938 1307 |
| Website: | www.Traders.com |
| E-mail address: | DPenn@traders.com |
Traders' Resource Links | |
| Charting the Stock Market: The Wyckoff Method -- Books | |
| Working-Money.com -- Online Trading Services | |
| Traders.com Advantage -- Online Trading Services | |
| Technical Analysis of Stocks & Commodities -- Publications and Newsletters | |
| Working Money, at Working-Money.com -- Publications and Newsletters | |
| Traders.com Advantage -- Publications and Newsletters | |
| Professional Traders Starter Kit -- Software | |
Click here for more information about our publications!
Comments
Date: 09/27/06Rank: 4Comment:

Request Information From Our Sponsors
- StockCharts.com, Inc.
- Candle Patterns
- Candlestick Charting Explained
- Intermarket Technical Analysis
- John Murphy on Chart Analysis
- John Murphy's Chart Pattern Recognition
- John Murphy's Market Message
- MurphyExplainsMarketAnalysis-Intermarket Analysis
- MurphyExplainsMarketAnalysis-Visual Analysis
- StockCharts.com
- Technical Analysis of the Financial Markets
- The Visual Investor
- VectorVest, Inc.
- Executive Premier Workshop
- One-Day Options Course
- OptionsPro
- Retirement Income Workshop
- Sure-Fire Trading Systems (VectorVest, Inc.)
- Trading as a Business Workshop
- VectorVest 7 EOD
- VectorVest 7 RealTime/IntraDay
- VectorVest AutoTester
- VectorVest Educational Services
- VectorVest OnLine
- VectorVest Options Analyzer
- VectorVest ProGraphics v6.0
- VectorVest ProTrader 7
- VectorVest RealTime Derby Tool
- VectorVest Simulator
- VectorVest Variator
- VectorVest Watchdog
