HOT TOPICS LIST
- MACD
- Fibonacci
- RSI
- Gann
- ADXR
- Stochastics
- Volume
- Triangles
- Futures
- Cycles
- Volatility
- ZIGZAG
- MESA
- Retracement
- Aroon
INDICATORS LIST
LIST OF TOPICS
PRINT THIS ARTICLE
by David Penn
A trend channel from the April lows continues to define price action for the utilities sector.
Position: N/A
David Penn
Technical Writer for Technical Analysis of STOCKS & COMMODITIES magazine, Working-Money.com, and Traders.com Advantage.
PRINT THIS ARTICLE
TREND-CHANNEL
Utilities Hold The Channel
09/26/06 08:08:38 AMby David Penn
A trend channel from the April lows continues to define price action for the utilities sector.
Position: N/A
In the first edition of his book Intermarket Technical Analysis, author and trader John J. Murphy notes of the utilities index and its "respectable record of anticipating turns in the Dow Industrials":This leading tendency of utility stocks is based on their relatively close ties to the bond market, which also is a leading indicator of stocks ... Because they are so interest-sensitive, utilities usually reflect interest rate changes (as reflected in the bond market) before those changes are reflected in the broader market of stocks. |

|
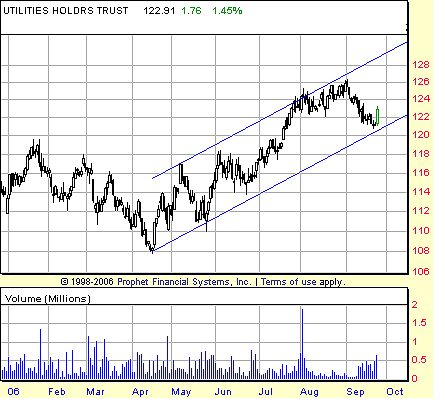
| FIGURE 1: UTILITIES HOLDRS TRUST, DAILY. The correction in September finds support at the lower boundary of a trend channel that has its origins in the April 2006 bottom in utilities stocks. |
| Graphic provided by: Prophet Financial, Inc. |
| |
| Looking at the relationship between the Dow 30, for example, and the utilities stocks (here represented in Figure 1 by the HOLDRS, UTH), one might question the relationship between utilities stocks and the rest of the stock market. After all, when utilities stocks were falling in the first quarter of 2006, the Dow industrials were ramping toward their May peak. And while the utilities stocks were testing their April bottom in May, well, we know what the industrials were doing. |
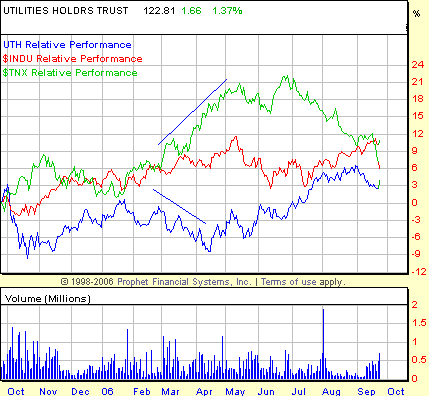
| The key to understanding that divergence between the leading role the utilities can play vis-a-vis the stock market is in inflationary expectations, particularly as reflected by the rate on the 10-year Treasury note. Figure 2, which compares the relative performance of the UTH, the $TNX (10-year T-note yield), and the Dow 30, shows that has long-term interest rates were increasing dramatically in the late summer, utilities stocks -- which are especially sensitive to interest rates -- were taking a beating. |

|
| FIGURE 2: RELATIVE PERFORMANCE CHART OF UTILITIES HOLDRS TRUST WITH DJIA AND 10-YEAR TREASURY NOTE YIELD INDEX ($TNX), DAILY. Utilities stocks lost ground in the spring of 2006, just as long-term interest rates were rapidly appreciating. |
| Graphic provided by: Prophet Financial, Inc. |
| |
| Not only that, as interest rates peaked and began easing over the course of the summer, utilities stocks were quick to get their groove back. In fact, utilities stocks, as measured by the UTH, actually bottomed two months before the $TNX (our proxy for long-term interest rates) finally topped. Over the past year, the utilities group and the yield on the 10-year have moved in opposite directions. Even the recent (Monday, September 25) pop in the utilities group was accompanied by a nosedive -- if even only a one-day drop -- in long-term rates. |
| While the relationship between the utilities group and the stock market appears a bit obscure at this point, the relationship between utilities and long-term interest rates is crystal clear. And if the behavior of the utilities group with respect to its trend channel from the April lows is to be believed -- behavior currently characterized by a rally off of the support provided by the lower boundary of the channel -- then look for long-term interest rates to continue to move lower in the near term. Those looking to keep track of those rates can do little better than to focus on the utilities stocks, or so it appears. They may or may not still lead the broader stock market. But the group definitely seems to have the inside scoop on long-term rates. |
Technical Writer for Technical Analysis of STOCKS & COMMODITIES magazine, Working-Money.com, and Traders.com Advantage.
| Title: | Technical Writer |
| Company: | Technical Analysis, Inc. |
| Address: | 4757 California Avenue SW |
| Seattle, WA 98116 | |
| Phone # for sales: | 206 938 0570 |
| Fax: | 206 938 1307 |
| Website: | www.Traders.com |
| E-mail address: | DPenn@traders.com |
Traders' Resource Links | |
| Charting the Stock Market: The Wyckoff Method -- Books | |
| Working-Money.com -- Online Trading Services | |
| Traders.com Advantage -- Online Trading Services | |
| Technical Analysis of Stocks & Commodities -- Publications and Newsletters | |
| Working Money, at Working-Money.com -- Publications and Newsletters | |
| Traders.com Advantage -- Publications and Newsletters | |
| Professional Traders Starter Kit -- Software | |
Click here for more information about our publications!
Comments
Date: 09/27/06Rank: 3Comment:

Request Information From Our Sponsors
- VectorVest, Inc.
- Executive Premier Workshop
- One-Day Options Course
- OptionsPro
- Retirement Income Workshop
- Sure-Fire Trading Systems (VectorVest, Inc.)
- Trading as a Business Workshop
- VectorVest 7 EOD
- VectorVest 7 RealTime/IntraDay
- VectorVest AutoTester
- VectorVest Educational Services
- VectorVest OnLine
- VectorVest Options Analyzer
- VectorVest ProGraphics v6.0
- VectorVest ProTrader 7
- VectorVest RealTime Derby Tool
- VectorVest Simulator
- VectorVest Variator
- VectorVest Watchdog
- StockCharts.com, Inc.
- Candle Patterns
- Candlestick Charting Explained
- Intermarket Technical Analysis
- John Murphy on Chart Analysis
- John Murphy's Chart Pattern Recognition
- John Murphy's Market Message
- MurphyExplainsMarketAnalysis-Intermarket Analysis
- MurphyExplainsMarketAnalysis-Visual Analysis
- StockCharts.com
- Technical Analysis of the Financial Markets
- The Visual Investor
