HOT TOPICS LIST
- MACD
- Fibonacci
- RSI
- Gann
- ADXR
- Stochastics
- Volume
- Triangles
- Futures
- Cycles
- Volatility
- ZIGZAG
- MESA
- Retracement
- Aroon
INDICATORS LIST
LIST OF TOPICS
PRINT THIS ARTICLE
by David Penn
A fourth-wave correction looks to be the prelude to higher prices in the S&P 500.
Position: N/A
David Penn
Technical Writer for Technical Analysis of STOCKS & COMMODITIES magazine, Working-Money.com, and Traders.com Advantage.
PRINT THIS ARTICLE
ELLIOTT WAVE
Wave Count Update
09/22/06 08:35:26 AMby David Penn
A fourth-wave correction looks to be the prelude to higher prices in the S&P 500.
Position: N/A
| I never look at Elliott wave patterns in isolation. Along with cycles (Tim Wood at cyclesman.com), a few cherished indicators, old-fashioned price and volume analysis and, most recently, the "hidden pivots" methodology of Rick Ackerman (rickackerman.com), Elliott wave patterns simply help round out the picture of what I expect from a market. And to rework Colonel John "Hannibal" Smith's classic line from the 1980s TV drama The A-Team, you've got to love it when these plans come together. |

|
| |
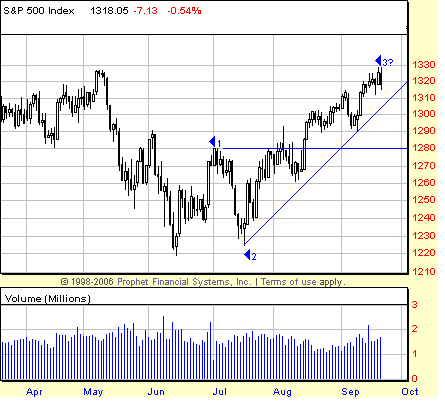
| Right now, "all of my indicators" are pointing to a correction in a bull market. The cycles I follow suggest that a trading low of some sort is due over the next few weeks, and my technical indicators -- as I pointed out in a recent Traders.com Advantage article ("Stalking The New Highs," September 18, 2006), are revealing negative divergences as the market moves higher. The Standard & Poor's 500 has yet to break the trendline that extends from the July lows (Figure 1), but clearly the market has decided to pause at resistance and it would require only a few points worth of selling -- or a week and a half or so of sideways movement -- to send the S&P 500 smashing into the side of that same trendline. |
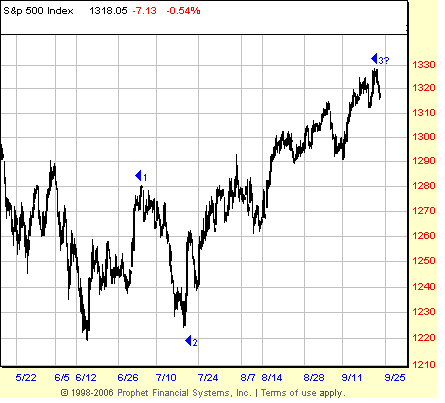
| The wave count described here provides for a somewhat more modest top than the one I suggested in my Working Money article "The Case For New Highs" (June 30, 2006). After testing the June lows with a corrective wave 2 in mid-July, the S&P 500 moved swiftly higher, taking out the July closing highs in early August and the June highs only a few weeks later. The bullishness of this wave 3 has been broadly recognized by most investors and traders, in large part because of the strong participation by everybody's favorite leading sector, semiconductors -- which haven't made a significant lower low since bottoming in July. See Figure 2. |

|
| |
| So what's next? Given the verticality of the corrective wave 2, it seems likely that wave 4 will be more of a sideways affair, a triangle, a flat, or even a double 3. Insofar as there really is precious little resistance between the May highs and the next important old high -- the January 2001 highs -- at 1383, I wouldn't be surprised if wave 4 took the form of a triangle. I say that because triangular corrections are notorious for powerful breakouts, and it is easy to envision a scenario in which that 70-odd point S&P gap between the May highs and the January 2001 highs is bridged swiftly in a disinflationary rally in which commodities continue to fall and stock shorts continue to be squeezed. |
| This is probably a good time to reiterate a few targets. I had projected a wave 3 top between 1317 and 1330, with a likely target of 1324. The closing high on September 20 was 1325. If wave 1 topped at 1280 and wave 3 topped at 1325, then we can derive a target wave 5 top between 1377 and 1390, with a likely target of 1384 -- the January 2001 highs. See any of my previous Elliott wave articles for tips on the target projection methodology. |
Technical Writer for Technical Analysis of STOCKS & COMMODITIES magazine, Working-Money.com, and Traders.com Advantage.
| Title: | Technical Writer |
| Company: | Technical Analysis, Inc. |
| Address: | 4757 California Avenue SW |
| Seattle, WA 98116 | |
| Phone # for sales: | 206 938 0570 |
| Fax: | 206 938 1307 |
| Website: | www.Traders.com |
| E-mail address: | DPenn@traders.com |
Traders' Resource Links | |
| Charting the Stock Market: The Wyckoff Method -- Books | |
| Working-Money.com -- Online Trading Services | |
| Traders.com Advantage -- Online Trading Services | |
| Technical Analysis of Stocks & Commodities -- Publications and Newsletters | |
| Working Money, at Working-Money.com -- Publications and Newsletters | |
| Traders.com Advantage -- Publications and Newsletters | |
| Professional Traders Starter Kit -- Software | |
Click here for more information about our publications!
Comments
Date: 09/23/06Rank: 3Comment:
Date: 09/27/06Rank: 5Comment: Its the 27th..S and P closed higher than the 1326 resistance...plus the noise. Do you still see a pull back here before moving to new highs. DrB

Request Information From Our Sponsors
- StockCharts.com, Inc.
- Candle Patterns
- Candlestick Charting Explained
- Intermarket Technical Analysis
- John Murphy on Chart Analysis
- John Murphy's Chart Pattern Recognition
- John Murphy's Market Message
- MurphyExplainsMarketAnalysis-Intermarket Analysis
- MurphyExplainsMarketAnalysis-Visual Analysis
- StockCharts.com
- Technical Analysis of the Financial Markets
- The Visual Investor
- VectorVest, Inc.
- Executive Premier Workshop
- One-Day Options Course
- OptionsPro
- Retirement Income Workshop
- Sure-Fire Trading Systems (VectorVest, Inc.)
- Trading as a Business Workshop
- VectorVest 7 EOD
- VectorVest 7 RealTime/IntraDay
- VectorVest AutoTester
- VectorVest Educational Services
- VectorVest OnLine
- VectorVest Options Analyzer
- VectorVest ProGraphics v6.0
- VectorVest ProTrader 7
- VectorVest RealTime Derby Tool
- VectorVest Simulator
- VectorVest Variator
- VectorVest Watchdog
