HOT TOPICS LIST
- MACD
- Fibonacci
- RSI
- Gann
- ADXR
- Stochastics
- Volume
- Triangles
- Futures
- Cycles
- Volatility
- ZIGZAG
- MESA
- Retracement
- Aroon
INDICATORS LIST
LIST OF TOPICS
PRINT THIS ARTICLE
by David Penn
The implosion of a massive hedge fund reveals traders as once again too smart for their own good.
Position: N/A
David Penn
Technical Writer for Technical Analysis of STOCKS & COMMODITIES magazine, Working-Money.com, and Traders.com Advantage.
PRINT THIS ARTICLE
REVERSAL
Hedging Gas
09/21/06 08:42:52 AMby David Penn
The implosion of a massive hedge fund reveals traders as once again too smart for their own good.
Position: N/A
| There are probably a million reasons why I'll never run one of the nation's largest hedge funds. But one of those reasons won't be my inability to tell a downtrend from an uptrend, or my failure to understand that when prices make a high, pull back, make a higher high, then fail to follow through to the upside, a reversal is often in the making. |

|
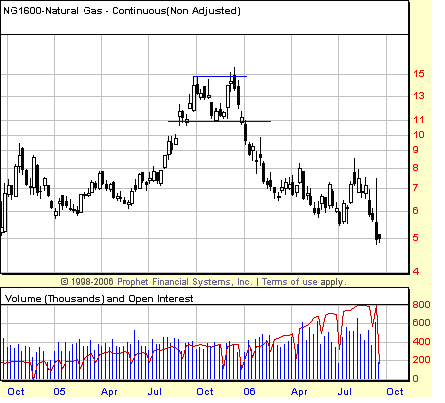
| FIGURE 1: NATURAL GAS, CONTINUOUS FUTURES, WEEKLY. A 2B top in the fourth quarter of 2005 combines with an island reversal top to send natural gas futures plummeting to whence they came. |
| Graphic provided by: Prophet Financial, Inc. |
| |
| The financial media is all abuzz about the reports of "enormous losses" suffered by Amaranth Advisors, a Connecticut hedge fund that reportedly made $1 billion in 2005 betting on energy prices. Days ago, the fund reported it had lost in excess of $3 billion in the collapse of natural gas prices in 2006. |
| Specifically, the fund claims that its losses were due to bets that the spread between the March and April 2007 natural gas contracts would widen. That spread, in fact, did not widen but instead grew tighter as natural gas prices fell. While the fund allegedly lost money on a number of natural gas–related bets, The New York Times is reporting that the spread bet was the most costly. |

|
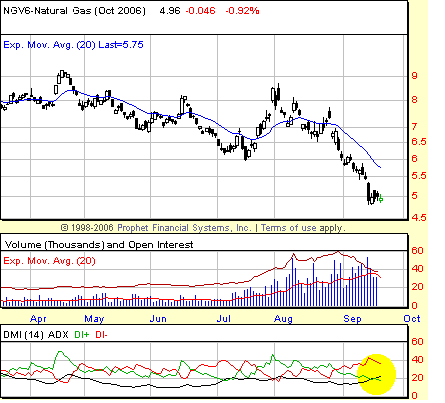
| FIGURE 2: NATURAL GAS, OCTOBER FUTURES, DAILY. The ADX suggests that even at these levels, the bearish trend could be intensifying. Note the way the DMI (in black) is crossing over the positive directional movement line or DI+ (in green). |
| Graphic provided by: Prophet Financial, Inc. |
| |
| I know more about NFL point spreads than I do about trading futures spreads. But as is often the case during the post-mortem of a hedge fund implosion, one can't help but wonder what these guys were thinking. As 2005 rolled over into 2006, the chart of continuous natural gas futures clearly shows how prices gapped up late in the third quarter of 2005, traded in a wide range between $11 and $15, then gapped back down late in the fourth quarter of 2005. This created an island gap which, when combined with the 2B top shown in the weekly chart (Figure 1), was more likely than not to represent a reversal than a continuation pattern. |
| In the Times coverage of the event, it was suggested that Amaranth's losses might be larger than the $3 billion the company has already copped to. Nothing specific was noted in the article, but it does look as if natural gas prices might be headed still lower. The average directional movement index (ADX) in Figure 2 shows the directional movement index (DMI) line (in black) crossing up and over a declining positive directional movement line or DI+ (in green). As Price Headley (of bigtrends.com) points out in his book Big Trends In Trading, this development is often the signal that a new bearish trend is under way. That may seem hard to believe, given the losses already suffered by natural gas bulls. But as prices also form a mildly triangular consolidation around the $5 level, the benefit of the doubt belongs to the bears. |
Technical Writer for Technical Analysis of STOCKS & COMMODITIES magazine, Working-Money.com, and Traders.com Advantage.
| Title: | Technical Writer |
| Company: | Technical Analysis, Inc. |
| Address: | 4757 California Avenue SW |
| Seattle, WA 98116 | |
| Phone # for sales: | 206 938 0570 |
| Fax: | 206 938 1307 |
| Website: | www.Traders.com |
| E-mail address: | DPenn@traders.com |
Traders' Resource Links | |
| Charting the Stock Market: The Wyckoff Method -- Books | |
| Working-Money.com -- Online Trading Services | |
| Traders.com Advantage -- Online Trading Services | |
| Technical Analysis of Stocks & Commodities -- Publications and Newsletters | |
| Working Money, at Working-Money.com -- Publications and Newsletters | |
| Traders.com Advantage -- Publications and Newsletters | |
| Professional Traders Starter Kit -- Software | |
Click here for more information about our publications!
Comments
Date: 09/23/06Rank: 2Comment:

Request Information From Our Sponsors
- StockCharts.com, Inc.
- Candle Patterns
- Candlestick Charting Explained
- Intermarket Technical Analysis
- John Murphy on Chart Analysis
- John Murphy's Chart Pattern Recognition
- John Murphy's Market Message
- MurphyExplainsMarketAnalysis-Intermarket Analysis
- MurphyExplainsMarketAnalysis-Visual Analysis
- StockCharts.com
- Technical Analysis of the Financial Markets
- The Visual Investor
- VectorVest, Inc.
- Executive Premier Workshop
- One-Day Options Course
- OptionsPro
- Retirement Income Workshop
- Sure-Fire Trading Systems (VectorVest, Inc.)
- Trading as a Business Workshop
- VectorVest 7 EOD
- VectorVest 7 RealTime/IntraDay
- VectorVest AutoTester
- VectorVest Educational Services
- VectorVest OnLine
- VectorVest Options Analyzer
- VectorVest ProGraphics v6.0
- VectorVest ProTrader 7
- VectorVest RealTime Derby Tool
- VectorVest Simulator
- VectorVest Variator
- VectorVest Watchdog
