HOT TOPICS LIST
- MACD
- Fibonacci
- RSI
- Gann
- ADXR
- Stochastics
- Volume
- Triangles
- Futures
- Cycles
- Volatility
- ZIGZAG
- MESA
- Retracement
- Aroon
INDICATORS LIST
LIST OF TOPICS
PRINT THIS ARTICLE
by Gary Grosschadl
After a nine-month consolidation, pizza specialist Papa John's is breaking higher.
Position: Buy
Gary Grosschadl
Independent Canadian equities trader and technical analyst based in Peterborough
Ontario, Canada.
PRINT THIS ARTICLE
RECTANGLES
PZZA Rising
09/19/06 09:10:26 AMby Gary Grosschadl
After a nine-month consolidation, pizza specialist Papa John's is breaking higher.
Position: Buy
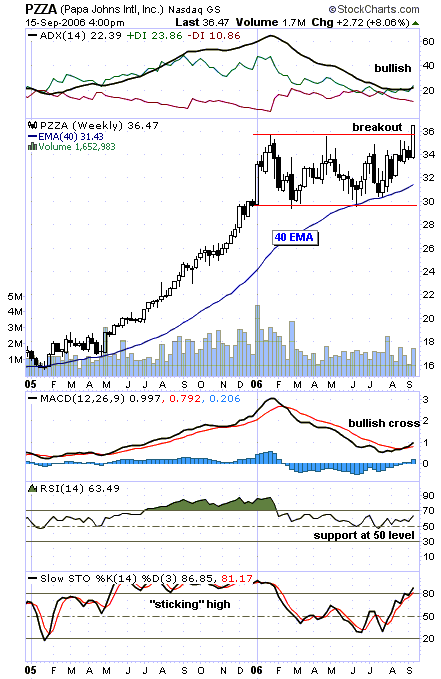
| This weekly chart (Figure 1) of Papa John's (PZZA) shows a breakout from a trading range. The trading range took the form of a rectangle formation and is considered a continuation pattern. The rectangle (sometimes referred to as "trading range," "consolidation zone," or "congestion area") was a pause in the previous trend. |
| The first upside target would be equal to the width of the rectangle being six points — that is, $42. The eventual move could be much higher if this is a mere pause in a strong rising trend. |

|
| FIGURE 1: PAPA JOHN'S, WEEKLY. This rectangle breakout with a strong prior trend looks enticing. |
| Graphic provided by: StockCharts.com. |
| |
| Although the chart and indicators look strong, there is a fly in the ointment — or, perhaps, a hair on the pizza. The best breakouts happen on exceptional volume, illustrating confidence in the move higher. Here, the best that can be said is that it is on rising volume, as it's higher than the previous two weeks. The volume will have to continue to rise to bring in more bulls. |
| Several indicators are noteworthy. At the top of the chart, the directional movement indicator (DMI), characterized by its three components, is in a bullish stance. The average directional movement index (ADX) is starting to upslope above the 20 level, hinting at growing trend strength. Meanwhile, +DI (positive directional indicator) is correctly above -DI (negative directional indicator), meaning that bullish power has the upper hand over bearish power. Below the chart, the MACD (moving average convergence/divergence) shows a bullish cross above the zero-line. This too hints at growing trend strength and a shift to upside power. The relative trend strength (RSI) depicts a bounce off its key 50 level of support. The stochastic oscillator is a little more cautionary in that the area above 80 is considered overbought. A downturn below the 80-level normally signals a downleg beginning and usually occurs sooner than later when the overbought zone is entered. However, looking back to June 2005, note how long the stochastic "stuck" high. This is a great example of how this indicator can stay overbought for an extended time if the trend is strong enough. I find this to be a rather rare event, at least for the duration shown. |
| In summary, this breakout bears watching as the prior trend was so strong, but more volume would be a comfort for the bulls. |
Independent Canadian equities trader and technical analyst based in Peterborough
Ontario, Canada.
| Website: | www.whatsonsale.ca/financial.html |
| E-mail address: | gwg7@sympatico.ca |
Click here for more information about our publications!
Comments
Date: 09/23/06Rank: 5Comment:

Request Information From Our Sponsors
- VectorVest, Inc.
- Executive Premier Workshop
- One-Day Options Course
- OptionsPro
- Retirement Income Workshop
- Sure-Fire Trading Systems (VectorVest, Inc.)
- Trading as a Business Workshop
- VectorVest 7 EOD
- VectorVest 7 RealTime/IntraDay
- VectorVest AutoTester
- VectorVest Educational Services
- VectorVest OnLine
- VectorVest Options Analyzer
- VectorVest ProGraphics v6.0
- VectorVest ProTrader 7
- VectorVest RealTime Derby Tool
- VectorVest Simulator
- VectorVest Variator
- VectorVest Watchdog
- StockCharts.com, Inc.
- Candle Patterns
- Candlestick Charting Explained
- Intermarket Technical Analysis
- John Murphy on Chart Analysis
- John Murphy's Chart Pattern Recognition
- John Murphy's Market Message
- MurphyExplainsMarketAnalysis-Intermarket Analysis
- MurphyExplainsMarketAnalysis-Visual Analysis
- StockCharts.com
- Technical Analysis of the Financial Markets
- The Visual Investor
