HOT TOPICS LIST
- MACD
- Fibonacci
- RSI
- Gann
- ADXR
- Stochastics
- Volume
- Triangles
- Futures
- Cycles
- Volatility
- ZIGZAG
- MESA
- Retracement
- Aroon
INDICATORS LIST
LIST OF TOPICS
PRINT THIS ARTICLE
by David Penn
When "BusinessWeek" magazine starts panicking, savvy traders start buying.
Position: N/A
David Penn
Technical Writer for Technical Analysis of STOCKS & COMMODITIES magazine, Working-Money.com, and Traders.com Advantage.
PRINT THIS ARTICLE
REVERSAL
Housing Stocks Head Higher
09/19/06 08:55:56 AMby David Penn
When "BusinessWeek" magazine starts panicking, savvy traders start buying.
Position: N/A
| Who says the watched pot never boils? The reliability of the BusinessWeek cover contrarian play has got to be running neck-and-neck with the "success" rate of the Sports Illustrated curse. The Sports Illustrated curse, in case you're not familiar with it, suggests that the athlete or team that appears on the cover of the preeminent sports weekly is likely to suffer a reversal of fortune at some point in the season — often a reversal so catastrophic as to make people wonder later why so-and-so was on the cover in the first place. My favorite example of this, as an University of Arizona (UA) alum, was the fate of "Desert Swarm," the much-heralded defense of the UA football team that struggled to an underachieving 8–4 after appearing on the cover of SI a month before the season started. |

|
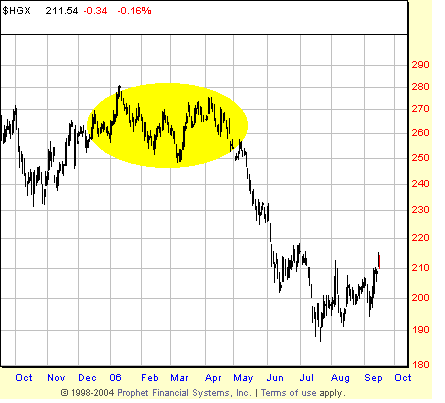
| FIGURE 1: PHILADELPHIA HOUSING SECTOR INDEX, DAILY. After breaking down from a consolidation first in the mid-spring, housing stocks shed more than 30% of their value before rebounding and starting to move higher in the autumn. |
| Graphic provided by: Prophet Financial, Inc. |
| |
| If you don't know by now, BusinessWeek may have once again provided investors with a gift in the form of its recent "Nightmare Mortgage" cover story. The article was limited for the most part to the problem of options ARMs (adjustable-rate mortgages). However, the meme that created the article, that put it on the cover with an illustration of a snake coiled around a hapless home, was borne of the wholesale anxiety and pessimism that had led to the bear market in housing stocks. |
| The problem? This bear market had been in effect since the spring and, predictably enough, by the time BusinessWeek got around to putting the bear market in housing stocks on its front cover, those stocks had bottomed. It now appears that these same stocks are actually rising. |

|
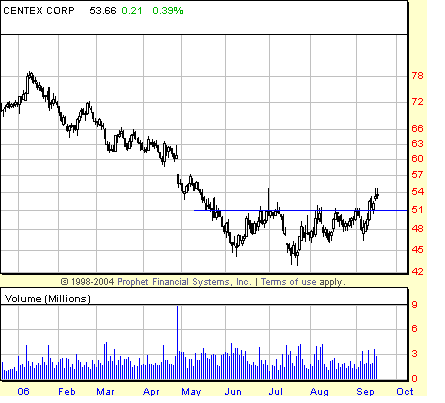
| FIGURE 2: CENTEX CORP., DAILY. This head & shoulders formation in CTX took a little over three months to develop and suggests a bounce to at least the 57–60 area, where the stock left a gap during its descent from 78. |
| Graphic provided by: Prophet Financial, Inc. |
| |
| As someone who has been paying a lot of attention to the energy stocks, it strikes me that the chart of the housing index over the past several months looks like an upside-down version of the oil service index. That is to say, whereas the oil stocks appear to have finally topped, the housing stocks appear to have finally bottomed. Figure 1, which shows the chart of the $HGX, the Philadelphia Housing Sector Index, shows a market that began making significant lows in June and July and has started making higher lows in August and again in September. |
| A similar pattern of higher lows is seen in the chart of Centex Corp. (CTX) in Figure 2. As I've written before, I'm most interested in higher lows when looking for new uptrends. The higher highs will take care of themselves, and often a pattern of higher lows and flat highs creates the sort of situation (namely, an ascending triangle) that tends to lead to outstanding gains to the upside in any event. In addition to a pattern of higher lows in CTX, the chart also reveals Centex to be developing a head & shoulders bottom. While not picture-perfect, the stock has clearly made a sizable consolidation after a significant decline and whether we wanted to call this consolidation a triple bottom, a head & shoulders bottom, or just a summertime, rectangular housing stock bottom makes little difference in terms of how traders and speculators can use this consolidation not only to mark a potential bottom, but also to game the potential upside that might follow in its wake. |
Technical Writer for Technical Analysis of STOCKS & COMMODITIES magazine, Working-Money.com, and Traders.com Advantage.
| Title: | Technical Writer |
| Company: | Technical Analysis, Inc. |
| Address: | 4757 California Avenue SW |
| Seattle, WA 98116 | |
| Phone # for sales: | 206 938 0570 |
| Fax: | 206 938 1307 |
| Website: | www.Traders.com |
| E-mail address: | DPenn@traders.com |
Traders' Resource Links | |
| Charting the Stock Market: The Wyckoff Method -- Books | |
| Working-Money.com -- Online Trading Services | |
| Traders.com Advantage -- Online Trading Services | |
| Technical Analysis of Stocks & Commodities -- Publications and Newsletters | |
| Working Money, at Working-Money.com -- Publications and Newsletters | |
| Traders.com Advantage -- Publications and Newsletters | |
| Professional Traders Starter Kit -- Software | |
Click here for more information about our publications!
Comments
Date: 09/23/06Rank: 3Comment:

Request Information From Our Sponsors
- StockCharts.com, Inc.
- Candle Patterns
- Candlestick Charting Explained
- Intermarket Technical Analysis
- John Murphy on Chart Analysis
- John Murphy's Chart Pattern Recognition
- John Murphy's Market Message
- MurphyExplainsMarketAnalysis-Intermarket Analysis
- MurphyExplainsMarketAnalysis-Visual Analysis
- StockCharts.com
- Technical Analysis of the Financial Markets
- The Visual Investor
- VectorVest, Inc.
- Executive Premier Workshop
- One-Day Options Course
- OptionsPro
- Retirement Income Workshop
- Sure-Fire Trading Systems (VectorVest, Inc.)
- Trading as a Business Workshop
- VectorVest 7 EOD
- VectorVest 7 RealTime/IntraDay
- VectorVest AutoTester
- VectorVest Educational Services
- VectorVest OnLine
- VectorVest Options Analyzer
- VectorVest ProGraphics v6.0
- VectorVest ProTrader 7
- VectorVest RealTime Derby Tool
- VectorVest Simulator
- VectorVest Variator
- VectorVest Watchdog
