HOT TOPICS LIST
- MACD
- Fibonacci
- RSI
- Gann
- ADXR
- Stochastics
- Volume
- Triangles
- Futures
- Cycles
- Volatility
- ZIGZAG
- MESA
- Retracement
- Aroon
INDICATORS LIST
LIST OF TOPICS
PRINT THIS ARTICLE
by David Penn
Will the running negative divergences in the Dow Jones Industrial Average end the current rally — or merely slow it down?
Position: N/A
David Penn
Technical Writer for Technical Analysis of STOCKS & COMMODITIES magazine, Working-Money.com, and Traders.com Advantage.
PRINT THIS ARTICLE
NEW HIGHS-NEW LOWS
Stalking The New Highs
09/18/06 02:29:10 PMby David Penn
Will the running negative divergences in the Dow Jones Industrial Average end the current rally — or merely slow it down?
Position: N/A
| Based on the cycles work of Tim Wood (cyclesman.com), there is good reason to question the staying power of the current rally in the Dow 30. Recall that the low in July was a significant short- and intermediate-term low — which is one of the reasons I was bullish in the late summer (see my Traders.com Advantage articles, "A 2B Bottom Test In the Dow," July 19, 2006; and "Cannons And Trumpets," July 27, 2006; as well as my Working-Money article, "The Case For New Highs," June 30, 2006). This meant that the rally from such short- and intermediate-term lows would be one worth exploiting. |

|
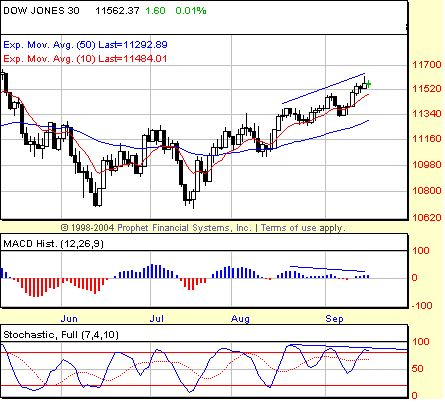
| FIGURE 1: DOW JONES INDUSTRIAL AVERAGE, DAILY. Running divergences in the stochastic and the MACD histogram point to the likelihood of at least a short-term top in large-cap stocks. |
| Graphic provided by: Prophet Financial, Inc. |
| |
| Two months later and several hundred Dow points higher, where are we now? The same cycles work that helped anticipate the mid-summer low is currently warning that the markets may be overextended to the upside. There is additional technical evidence that suggests that a correction of some sort is in the cards for the markets as well. Most prominently, the negative divergences in the stochastic and the moving average convergence/divergence (MACD) histogram have been hinting at the potential for weakness since the first days of September. But with the Dow Jones Industrial Average (DJIA) approaching all-time highs, it should not surprise anyone if that mere prospect of challenging that historic resistance causes the market to pause and gather itself before pressing higher. |
| Note the three successively lower peaks in both indicators: August 18 (August 21 in the stochastic), September 5, and September 15. Compare these same dates in the indicator to like dates in price. On the exact same days that the indicators are marking lower and lower peaks, the Dow industrials is marking higher and higher peaks. As long as this pattern continues, the DJIA will be increasingly seen as a potential source of weakness. In a market that only until recently has been led almost exclusively by the larger-cap stocks (note the larger-cap S&P 100 has made a new high while the more capitalization-diverse S&P 500 lags), this is reason for some concern. See Figure 1. |

|
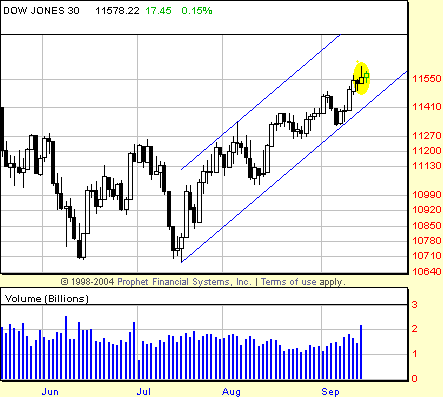
| FIGURE 2: DOW JONES INDUSTRIAL AVERAGE, DAILY. The shooting star on the option's expiration day of September 15 is one of the few price-and-volume clues that the rally off the July lows is overextended and in need of correction. |
| Graphic provided by: Prophet Financial, Inc. |
| |
| I've tried to look at charts as price and volume maps before adding the indicators. But because of the cyclical (and Elliott wave) hints that were emerging, I wanted to use some of the more exacting tools for spotting potential tops in markets. Looking strictly at price and volume, however, there are a few things that could serve as warnings. First is the shooting star candlestick on huge volume from September 15 (Figure 2). The volume on that options expiration day was larger than anything that had hit the Dow 30 since the top in late June. Generally speaking, a shooting star candlestick should not only feature a small "real body" and a long upper shadow, but the candlestick should also gap away from the previous candlestick. This isn't a mandatory criterion — plenty of shooting stars have marked tops without first gapping away from the previous candlestick. So the fact that this shooting star has not done so should not be a main reason for rejecting its capacity to warn traders and investors of the possibility that the upside has become significantly limited in the near term. |
| Another potentially bearish development will come to pass if the Dow 30 is unable to rally back into the upper half of its trend channel from the July lows. Since mid-August, the industrials have remained in the lower half of the two-month channel. At this point, for the channel to remain valid, the DJIA would have to move almost vertically over the next several days. Given the unlikelihood of this, it seems more likely that the Dow industrials will move sideways, testing the lower boundary of the channel for support, before it will be able to launch itself higher in any significant or enduring way. |
Technical Writer for Technical Analysis of STOCKS & COMMODITIES magazine, Working-Money.com, and Traders.com Advantage.
| Title: | Technical Writer |
| Company: | Technical Analysis, Inc. |
| Address: | 4757 California Avenue SW |
| Seattle, WA 98116 | |
| Phone # for sales: | 206 938 0570 |
| Fax: | 206 938 1307 |
| Website: | www.Traders.com |
| E-mail address: | DPenn@traders.com |
Traders' Resource Links | |
| Charting the Stock Market: The Wyckoff Method -- Books | |
| Working-Money.com -- Online Trading Services | |
| Traders.com Advantage -- Online Trading Services | |
| Technical Analysis of Stocks & Commodities -- Publications and Newsletters | |
| Working Money, at Working-Money.com -- Publications and Newsletters | |
| Traders.com Advantage -- Publications and Newsletters | |
| Professional Traders Starter Kit -- Software | |
Click here for more information about our publications!
Comments
Date: 09/23/06Rank: 3Comment:

Request Information From Our Sponsors
- StockCharts.com, Inc.
- Candle Patterns
- Candlestick Charting Explained
- Intermarket Technical Analysis
- John Murphy on Chart Analysis
- John Murphy's Chart Pattern Recognition
- John Murphy's Market Message
- MurphyExplainsMarketAnalysis-Intermarket Analysis
- MurphyExplainsMarketAnalysis-Visual Analysis
- StockCharts.com
- Technical Analysis of the Financial Markets
- The Visual Investor
- VectorVest, Inc.
- Executive Premier Workshop
- One-Day Options Course
- OptionsPro
- Retirement Income Workshop
- Sure-Fire Trading Systems (VectorVest, Inc.)
- Trading as a Business Workshop
- VectorVest 7 EOD
- VectorVest 7 RealTime/IntraDay
- VectorVest AutoTester
- VectorVest Educational Services
- VectorVest OnLine
- VectorVest Options Analyzer
- VectorVest ProGraphics v6.0
- VectorVest ProTrader 7
- VectorVest RealTime Derby Tool
- VectorVest Simulator
- VectorVest Variator
- VectorVest Watchdog
