HOT TOPICS LIST
- MACD
- Fibonacci
- RSI
- Gann
- ADXR
- Stochastics
- Volume
- Triangles
- Futures
- Cycles
- Volatility
- ZIGZAG
- MESA
- Retracement
- Aroon
INDICATORS LIST
LIST OF TOPICS
PRINT THIS ARTICLE
by Paolo Pezzutti
These patterns are relatively rare, but traders must be aware of their potential profit opportunities.
Position: N/A
Paolo Pezzutti
Author of the book "Trading the US Markets - A Comprehensive Guide to US Markets for International Traders and Investors" - Harriman House (July 2008)
PRINT THIS ARTICLE
BROADENING FORMATION
Broadening Patterns: An Overview
09/18/06 03:22:59 PMby Paolo Pezzutti
These patterns are relatively rare, but traders must be aware of their potential profit opportunities.
Position: N/A
| The broadening formation is an unusual variation of a triangle. Actually, it is an inverted triangle or a triangle turned backward. Triangles are characterized by converging trendlines. The broadening formation is the opposite. In the broadening formation, the trendlines diverge. Instead of increasingly narrowing fluctuations in prices, the broadening formation is formed by price swings that are increasingly widening. The volume pattern is different than in triangles. In triangles, volume diminishes as the price swings develop. Volume in broadening formations usually expands along with the wider price swings, indicating a volatile market and representing an unusual public participation. Often, it appears at major tops. When the pattern develops, price touches each trendline at least twice and swings in a progressively wider range; the minor highs get higher and the minor lows get lower. In a broadening top, you have a rally to a new high, weakness to an intermediate support level, a second rally to a higher high on increased volume and decline through the intermediate support level, and a third rally to a higher high on strong volume, followed by an eventual collapse. The opposite is true in broadening bottoms. The objective of the pattern is calculated by subtracting the height of the pattern from the breakout level. Trying to determine when a breakout will occur in broadening chart patterns is difficult. Partial rises or partial declines can improve the odds of making a correct decision. These signals predict immediate breakouts and may help indicate their direction. You have a partial rise when price leaves the bottom trendline and works its way higher but fails to touch or come close to the top trendline before turning away. Partial declines are just the opposite. In his writings, Thomas Bulkowski displays statistics that support the indication of predictability provided by partial rises and declines printed during the broadening formations. He also reports that false breakouts are relatively limited. As broadening formations are characterized by high public participation, the breakout generates normally high volatility. The public indecision and change of attitude expressed by the public during the development of the formation finally is addressed at the same time toward the same direction. The outcome is a directional and volatile move. There are different tactics you can apply to trade broadening formations. In particular, you can: -Anticipate the breakout entering a long or short position when prices test the lower or upper trendline some time after the beginning of the formation (for example, at the third test). The risk is high because the formation is not finalized, but the reward is much higher and you enter in quiet times. |
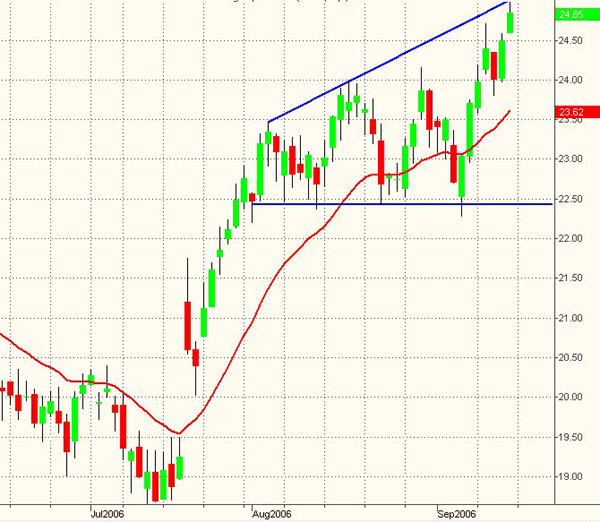
| In Figure 1, you can see the daily chart of Motorola (MOT). The stock has been developing a broadening formation since the end of July. Although the lower trendline is horizontal and not opening to the downside, the pattern is quite typical and presents a good potential should a breakout of the $22.50 level materialize. It is clear that the public uncertainty to the direction of prices is growing together with volatility. At present, prices are testing the upper trendline and the risk of opening long positions is getting higher. |

|
| FIGURE 1: MOTOROLA, DAILY. The MOT stock is testing the upper trendline of a broadening formation. |
| Graphic provided by: TradeStation. |
| |
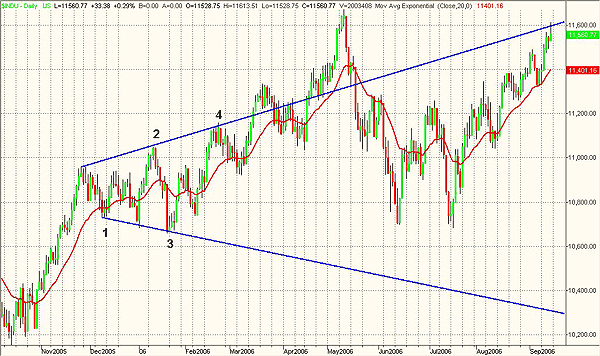
| Not all the patterns are successful. You can see that formations do not develop exactly as you might expect. For example, in Figure 2 you can see the Dow Jones Industrial Average (DJIA) daily chart, where a broadening formation developed between points 1 to 4. Instead of moving to the downside after point 4, prices continued at or above the upper trendline. Later, they entered again the trading range and now are retesting the upper trendline. Those who opened a short position at point 4 anticipating a move toward the lower trendline experienced a loss. |

|
| FIGURE 2: DJIA, DAILY. The Dow Jones Industrial Average has developed a broadening formation at the end of 2005. After point 4, however, prices did not break out to the downside and the pattern failed to materialize. |
| Graphic provided by: TradeStation. |
| |
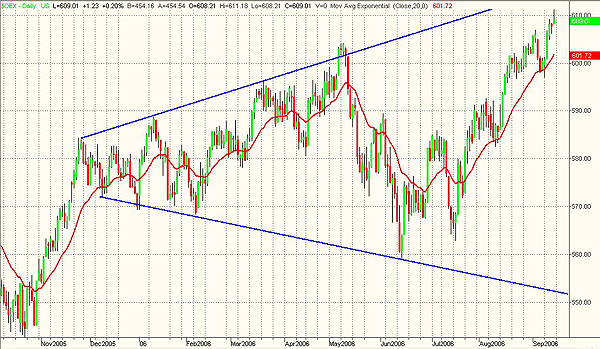
| In Figure 3, you can see the Standard & Poor's 100 index daily chart. The formation being developed is quite interesting. The formation development started back at the end of 2005. The two trendlines that contain prices are diverging, as it is typical in these formations. The trendlines, either the upper trendline and the lower one, have been touched already three times. At present, prices are moving once again toward the test of the upper trendline and are very close to this important test level. As the broadening formation develops, the swings get bigger. It is difficult that prices will manage to continue their move above the trendline. That level represents a suitable entry point for those who intend to open short positions. Should prices move to the downside to start a downtrend, the price objective would be quite impressive. |

|
| FIGURE 3: $OEX, DAILY. The S&P 100 index is still developing an interesting broadening formation. Prices are about to test the upper trendline. |
| Graphic provided by: TradeStation. |
| |
Author of the book "Trading the US Markets - A Comprehensive Guide to US Markets for International Traders and Investors" - Harriman House (July 2008)
| Address: | VIA ROBERTO AGO 26 POSTAL CODE 00166 |
| Rome, ITALY | |
| Phone # for sales: | +393357540708 |
| E-mail address: | pezzutti.paolo@tiscali.it |
Click here for more information about our publications!
Comments
Date: 09/19/06Rank: 5Comment:
Date: 09/23/06Rank: 3Comment:

Request Information From Our Sponsors
- StockCharts.com, Inc.
- Candle Patterns
- Candlestick Charting Explained
- Intermarket Technical Analysis
- John Murphy on Chart Analysis
- John Murphy's Chart Pattern Recognition
- John Murphy's Market Message
- MurphyExplainsMarketAnalysis-Intermarket Analysis
- MurphyExplainsMarketAnalysis-Visual Analysis
- StockCharts.com
- Technical Analysis of the Financial Markets
- The Visual Investor
- VectorVest, Inc.
- Executive Premier Workshop
- One-Day Options Course
- OptionsPro
- Retirement Income Workshop
- Sure-Fire Trading Systems (VectorVest, Inc.)
- Trading as a Business Workshop
- VectorVest 7 EOD
- VectorVest 7 RealTime/IntraDay
- VectorVest AutoTester
- VectorVest Educational Services
- VectorVest OnLine
- VectorVest Options Analyzer
- VectorVest ProGraphics v6.0
- VectorVest ProTrader 7
- VectorVest RealTime Derby Tool
- VectorVest Simulator
- VectorVest Variator
- VectorVest Watchdog
