HOT TOPICS LIST
- MACD
- Fibonacci
- RSI
- Gann
- ADXR
- Stochastics
- Volume
- Triangles
- Futures
- Cycles
- Volatility
- ZIGZAG
- MESA
- Retracement
- Aroon
INDICATORS LIST
LIST OF TOPICS
PRINT THIS ARTICLE
by Koos van der Merwe
Is Qwest making a comeback, and will it reach the glorious heights of April 2000 once more?
Position: Sell
Koos van der Merwe
Has been a technical analyst since 1969, and has worked as a futures and options trader with First Financial Futures in Johannesburg, South Africa.
PRINT THIS ARTICLE
ELLIOTT WAVE
Looking At Qwest
09/12/06 01:28:29 PMby Koos van der Merwe
Is Qwest making a comeback, and will it reach the glorious heights of April 2000 once more?
Position: Sell
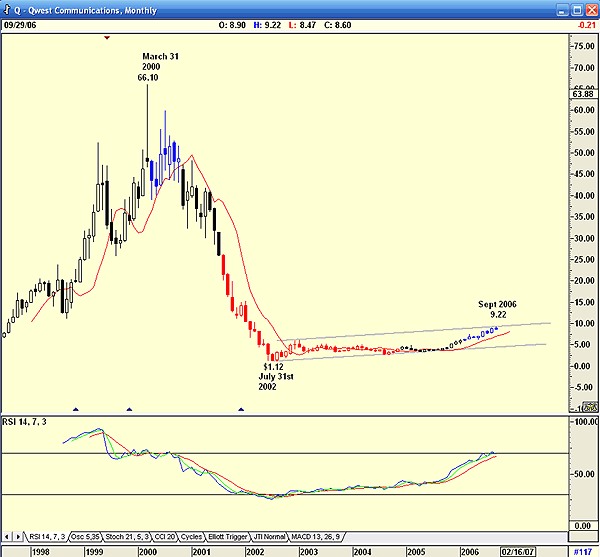
| Qwest Communications International (Q) is a broadband Internet communications company that provides advanced communication services, data, multimedia, and Internet-based services on a national and global basis; as well as wireless services, local telecommunications and related services, and directory services. The company principally serves large and mid-size business and government customers on a national and international basis, as well as residential and small-business customers. On March 30, 2000, Qwest Communications, on the back of the technology hype, reached a high of $66.10. From this lofty peak it collapsed to a low of $1.12 by July 31, 2002. Since that date, it has risen to test its upper resistance line at $9.22 on September 2006. Because of the spectacular rise over the past four years, various analysts have given it a five-star rating, but does it deserve it? Fundamentals say yes, but do the technicals agree with this? |

|
| FIGURE 1: QWEST COMMUNICATIONS, MONTHLY. After reaching dizzying heights in 2000 and then plummeting, this stock has been inching its way back up. Will it continue to do so? |
| Graphic provided by: AdvancedGET. |
| |
| Besides looking sick, my monthly chart (Figure 1) does show that a saucer formation could have formed. But with the testing of the upper resistance line at $9.22, and a relative strength index (RSI) that is approaching oversold levels, any purchases would appear to carry a greater degree of risk. |

|
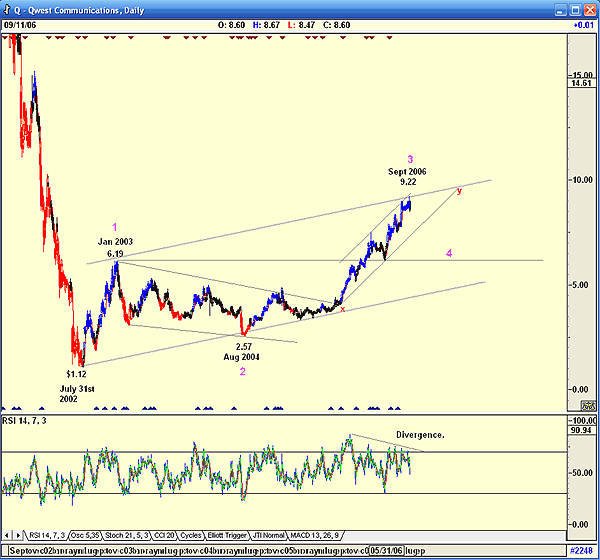
| FIGURE 2: QWEST COMMUNICATIONS, DAILY. Since July 2002, this stock has been making its way back up again. |
| Graphic provided by: AdvancedGET. |
| |
| My daily chart (Figure 2) shows the rise from July 31 to the present. The first thing that strikes you when you look at the chart is once again the catastrophic collapse on the left of the chart to $1.12, followed by a rise to $6.19 by January 2003. This suggests that the collapse was overdone... a dead-cat bounce, so to speak. From this level, it moved down to a low of $2.57 by August 2004 before embarking on what appears to be a dramatic rise to present levels — possibly the result of a five-star rating. At the moment the price is testing the resistance line at $9.22, but the divergence of the RSI is suggesting a correction. An attempt at a wave count does indicate that the correction could be a fourth-wave correction, and because wave 2 was a complicated correction, wave 4 should be simple. Whether the fourth wave will end at the 6.19 level or somewhere on the intermediate support line x-y is debatable, but time will decide. |
| I would not be a buyer of Q today, but would wait for it to complete its fourth wave, or when the RSI is oversold — below the 30 level. My charts are suggesting that it has still to earn its five-star rating. |
Has been a technical analyst since 1969, and has worked as a futures and options trader with First Financial Futures in Johannesburg, South Africa.
| Address: | 3256 West 24th Ave |
| Vancouver, BC | |
| Phone # for sales: | 6042634214 |
| E-mail address: | petroosp@gmail.com |
Click here for more information about our publications!
Comments
Date: 09/14/06Rank: 3Comment:

Request Information From Our Sponsors
- StockCharts.com, Inc.
- Candle Patterns
- Candlestick Charting Explained
- Intermarket Technical Analysis
- John Murphy on Chart Analysis
- John Murphy's Chart Pattern Recognition
- John Murphy's Market Message
- MurphyExplainsMarketAnalysis-Intermarket Analysis
- MurphyExplainsMarketAnalysis-Visual Analysis
- StockCharts.com
- Technical Analysis of the Financial Markets
- The Visual Investor
- VectorVest, Inc.
- Executive Premier Workshop
- One-Day Options Course
- OptionsPro
- Retirement Income Workshop
- Sure-Fire Trading Systems (VectorVest, Inc.)
- Trading as a Business Workshop
- VectorVest 7 EOD
- VectorVest 7 RealTime/IntraDay
- VectorVest AutoTester
- VectorVest Educational Services
- VectorVest OnLine
- VectorVest Options Analyzer
- VectorVest ProGraphics v6.0
- VectorVest ProTrader 7
- VectorVest RealTime Derby Tool
- VectorVest Simulator
- VectorVest Variator
- VectorVest Watchdog
