HOT TOPICS LIST
- MACD
- Fibonacci
- RSI
- Gann
- ADXR
- Stochastics
- Volume
- Triangles
- Futures
- Cycles
- Volatility
- ZIGZAG
- MESA
- Retracement
- Aroon
INDICATORS LIST
LIST OF TOPICS
PRINT THIS ARTICLE
by Paolo Pezzutti
This gold index has failed to break out from an ascending triangle formation, developing a high-volatility move to the downside.
Position: Sell
Paolo Pezzutti
Author of the book "Trading the US Markets - A Comprehensive Guide to US Markets for International Traders and Investors" - Harriman House (July 2008)
PRINT THIS ARTICLE
ASCENDING TRIANGLES
CBOE Gold Index: Triangle Breakout Failure
09/12/06 08:39:44 AMby Paolo Pezzutti
This gold index has failed to break out from an ascending triangle formation, developing a high-volatility move to the downside.
Position: Sell
| The CBOE gold index has recently printed a very interesting pattern, typically described in many technical analysis books: the failure of the breakout of an ascending triangle. Ascending triangles normally represent bullish formations, while descending triangles represent bearish ones. They are often referred to as continuation formations. At the beginning, triangles print high volatility. As they develop, volume dries up and volatility gets low. It is not simple to spot a triangle formation early. In case of bullish triangles, they might be exchanged easily for a double top, a rectangle, and so on. However, as they develop, it is easier to recognize and classify them. Ascending triangles rise toward a resistance level, testing it repeatedly. Buying pressure builds as prices test the upper boundary. Normally, they can print three tops before the breakout occurs. A vertical thrust often develops after the congestion and prices start a new trend. False moves, however, may happen near the apex points. The apex is the critical point where the formation reaches it with a low in volatility. When trading ascending triangles after a breakout on the upside, you can expect either the beginning of an uptrend or a pullback close to the apex and then a continuation of the uptrend or, finally, a failure and fallback through the apex in the opposite direction. |

|
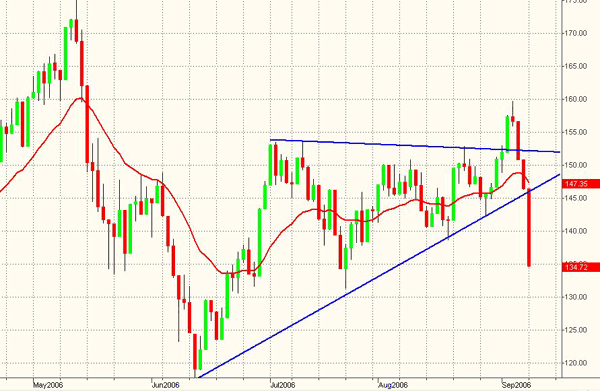
| FIGURE 1: CBOE GOLD INDEX, DAILY. The failure of the breakout on the upside has initiated a fast move in the opposite direction. |
| Graphic provided by: TradeStation. |
| |
| In Figure 1, you can see the daily chart of the CBOE gold index. After the May–June selloff, prices developed a three-month ascending triangle. The accumulation process is represented by the higher lows printed throughout the period. The breakout on the upside that occurred on September 5 seemed to indicate that a retest of the May top at about 170 could be an achievable objective. It was, in fact, the objective of the triangle formation. However, after one more session when prices did not manage to close near the high of the day, on September 7 the index reentered the triangle range, printing a long black candle. The failure of the breakout, normally, brings volatility in the opposite direction. In fact, this is what occurred with prices that dropped through the apex to the downside. After the breakout on the upside, volatility surges mainly because of stops placed above the resistance and buying by trend-followers. In this case, there was not enough money from the crowd to start a new trend. Capitalizing on false moves selling the apex fallback in the opposite direction of the breakout can be profitable because of the high-volatility environment; however, risk must be controlled with the use of a stop-loss. So far, the index has printed four negative sessions in a row. Volatility is very high. Monday's session has printed a wide-ranging day, which indicates the capitulation of the bulls and lower prices to come. |
| Although the best entry point would have been at higher levels when prices reentered the triangle range on September 7–8 in order to reduce risk, it is true that indications of lower prices provided by Monday's session could be still profitably traded. It is important, however, to find a low-risk entry point in coincidence with a pullback or a short-term retracement, as there is still potential to the downside. |
Author of the book "Trading the US Markets - A Comprehensive Guide to US Markets for International Traders and Investors" - Harriman House (July 2008)
| Address: | VIA ROBERTO AGO 26 POSTAL CODE 00166 |
| Rome, ITALY | |
| Phone # for sales: | +393357540708 |
| E-mail address: | pezzutti.paolo@tiscali.it |
Click here for more information about our publications!
Comments
Date: 09/12/06Rank: 4Comment:
Date: 09/13/06Rank: 4Comment:
Date: 09/16/06Rank: 5Comment:

Request Information From Our Sponsors
- StockCharts.com, Inc.
- Candle Patterns
- Candlestick Charting Explained
- Intermarket Technical Analysis
- John Murphy on Chart Analysis
- John Murphy's Chart Pattern Recognition
- John Murphy's Market Message
- MurphyExplainsMarketAnalysis-Intermarket Analysis
- MurphyExplainsMarketAnalysis-Visual Analysis
- StockCharts.com
- Technical Analysis of the Financial Markets
- The Visual Investor
- VectorVest, Inc.
- Executive Premier Workshop
- One-Day Options Course
- OptionsPro
- Retirement Income Workshop
- Sure-Fire Trading Systems (VectorVest, Inc.)
- Trading as a Business Workshop
- VectorVest 7 EOD
- VectorVest 7 RealTime/IntraDay
- VectorVest AutoTester
- VectorVest Educational Services
- VectorVest OnLine
- VectorVest Options Analyzer
- VectorVest ProGraphics v6.0
- VectorVest ProTrader 7
- VectorVest RealTime Derby Tool
- VectorVest Simulator
- VectorVest Variator
- VectorVest Watchdog
