HOT TOPICS LIST
- MACD
- Fibonacci
- RSI
- Gann
- ADXR
- Stochastics
- Volume
- Triangles
- Futures
- Cycles
- Volatility
- ZIGZAG
- MESA
- Retracement
- Aroon
INDICATORS LIST
LIST OF TOPICS
PRINT THIS ARTICLE
by David Penn
After a 10-month correction, could the US dollar's fortunes be on the verge of improvement?
Position: N/A
David Penn
Technical Writer for Technical Analysis of STOCKS & COMMODITIES magazine, Working-Money.com, and Traders.com Advantage.
PRINT THIS ARTICLE
REVERSAL
The Greenback Lows
09/08/06 03:12:18 PMby David Penn
After a 10-month correction, could the US dollar's fortunes be on the verge of improvement?
Position: N/A
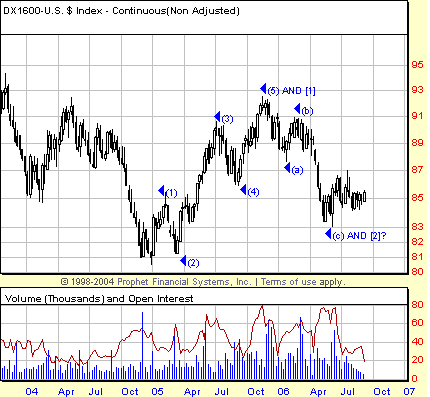
| Back in March 2006, I suggested that the dollar's correction that began in November 2005 was more likely to be sideways rather than sharply lower ("A Working Wave Count For The Greenback," March 10, 2006; Traders.com Advantage). That wave count was based on the theory that the November 2005 high was a wave (3) peak. However, the size of the correction from November to the present suggests to me that the rally from the December 2004 low to the November 2005 represented its own five-wave movement. In other words, the November 2005 peak was more likely a wave (5) peak rather than a wave (3) peak. See Figure 1. |

|
| FIGURE 1: US DOLLAR INDEX, CONTINUOUS FUTURES, WEEKLY. A revised wave count for the greenback puts the November 2005 high at the end of a completed five-wave sequence. |
| Graphic provided by: Prophet Financial, Inc. |
| |
| This means that the November 2005 to present correction is then a wave [2], using brackets as a substitute for the circled numbers and letters that denote a degree larger than the parenthetical numbers and letters. While it will remain difficult to know for sure whether this is true, there are a number of things that speculators can look for to provide further confirmation. |
| If the dollar is approaching a wave [2] low, then dollar pessimism should be at an extreme. Fears that the Federal Reserve is not doing enough to prevent inflation, or that the government is hiding a "real" inflation rate that is actually much higher than what is being reported, should be fairly rampant. Recall that early in a new bull market, the mood of the market is often as negative or worse than it was at the actual bottom. If the dollar is turning around as of the December 2004–March 2005 lows, then it is this fear of a dying dollar that should serve as a "wall of worry" as the greenback, to the mystery of most, begins to climb. |

|
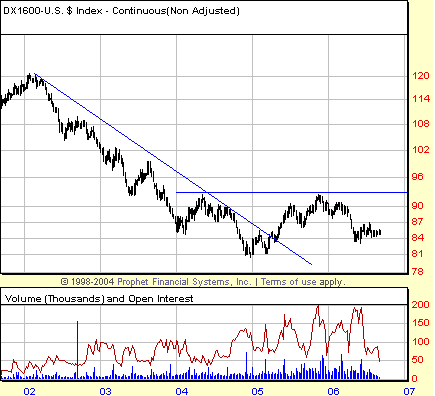
| FIGURE 2: US DOLLAR INDEX, CONTINUOUS FUTURES, WEEKLY. On a longer-term scale, the greenback has been processing a classic 1-2-3 trend reversal since the late spring of 2005. The market is currently in late stage 2 of that reversal, as the old downtrend in 2006 seeks to reassert itself after the bounce in 2005. |
| Graphic provided by: Prophet Financial, Inc. |
| |
| Of course, any climb is predicated on the dollar not taking out those December 2004–March 2005 lows some four or five cents below recent levels. The sideways consolidation that developed in the wake of the greenback's late spring decline has all the appearance of a continuation pattern after which further lows would follow. And taking the distance from the beginning of that decline to the low of the consolidation pattern and subtracting that amount from the high of the consolidation pattern projects a potential downside of 79—a new low. |
| From a long-term perspective that considers the bear market in the US dollar from its peak in the spring of 2002, the movement up from the December 2004–March 2005 bottom also represents the first stage of a 1-2-3 trend reversal (Figure 2). That first stage ended when the dollar ran into resistance at the 93 level—a level that coincided with the highs of a shorter, previous bear market rally in the first few months of 2004. The greenback could be said to be in the second stage of that trend reversal now, the stage at which the old trend attempts to reassert itself–in this case, with new lows. |
Technical Writer for Technical Analysis of STOCKS & COMMODITIES magazine, Working-Money.com, and Traders.com Advantage.
| Title: | Technical Writer |
| Company: | Technical Analysis, Inc. |
| Address: | 4757 California Avenue SW |
| Seattle, WA 98116 | |
| Phone # for sales: | 206 938 0570 |
| Fax: | 206 938 1307 |
| Website: | www.Traders.com |
| E-mail address: | DPenn@traders.com |
Traders' Resource Links | |
| Charting the Stock Market: The Wyckoff Method -- Books | |
| Working-Money.com -- Online Trading Services | |
| Traders.com Advantage -- Online Trading Services | |
| Technical Analysis of Stocks & Commodities -- Publications and Newsletters | |
| Working Money, at Working-Money.com -- Publications and Newsletters | |
| Traders.com Advantage -- Publications and Newsletters | |
| Professional Traders Starter Kit -- Software | |
Click here for more information about our publications!
Comments
Date: 09/08/06Rank: 3Comment:
Date: 10/01/06Rank: 3Comment:

Request Information From Our Sponsors
- VectorVest, Inc.
- Executive Premier Workshop
- One-Day Options Course
- OptionsPro
- Retirement Income Workshop
- Sure-Fire Trading Systems (VectorVest, Inc.)
- Trading as a Business Workshop
- VectorVest 7 EOD
- VectorVest 7 RealTime/IntraDay
- VectorVest AutoTester
- VectorVest Educational Services
- VectorVest OnLine
- VectorVest Options Analyzer
- VectorVest ProGraphics v6.0
- VectorVest ProTrader 7
- VectorVest RealTime Derby Tool
- VectorVest Simulator
- VectorVest Variator
- VectorVest Watchdog
- StockCharts.com, Inc.
- Candle Patterns
- Candlestick Charting Explained
- Intermarket Technical Analysis
- John Murphy on Chart Analysis
- John Murphy's Chart Pattern Recognition
- John Murphy's Market Message
- MurphyExplainsMarketAnalysis-Intermarket Analysis
- MurphyExplainsMarketAnalysis-Visual Analysis
- StockCharts.com
- Technical Analysis of the Financial Markets
- The Visual Investor
