HOT TOPICS LIST
- MACD
- Fibonacci
- RSI
- Gann
- ADXR
- Stochastics
- Volume
- Triangles
- Futures
- Cycles
- Volatility
- ZIGZAG
- MESA
- Retracement
- Aroon
INDICATORS LIST
LIST OF TOPICS
PRINT THIS ARTICLE
by David Penn
Failure to follow through to the upside after the move higher at the end of August could bring an end to the summer rally.
Position: N/A
David Penn
Technical Writer for Technical Analysis of STOCKS & COMMODITIES magazine, Working-Money.com, and Traders.com Advantage.
PRINT THIS ARTICLE
REVERSAL
2B Top In The Standard & Poor's 100
09/07/06 11:52:32 AMby David Penn
Failure to follow through to the upside after the move higher at the end of August could bring an end to the summer rally.
Position: N/A
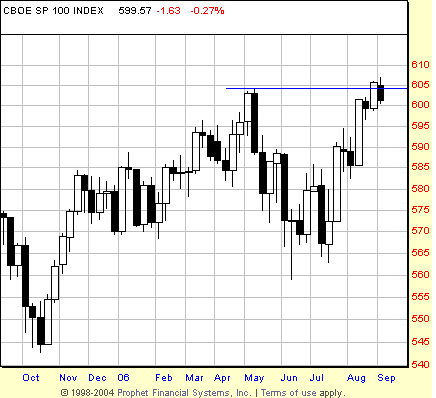
| I don't know how many times I need to remind myself to pay as much attention to weekly charts as I do to daily charts, especially when the indexes are concerned. Often, the weekly charts do such an excellent job of putting the daily gyrations of the market into a context that not only can be understood, but also can be profitably traded with a clearer sense of the risk and reward involved (Figure 1). |

|
| FIGURE 1: S&P 100, WEEKLY. Setting a new high in late August, the S&P 100 or $OEX needs to show follow-through to the upside or risk speculation that the market is ripe for reversal. |
| Graphic provided by: Prophet Financial, Inc. |
| |
| And if you combine weekly charts with the clarity provided courtesy of candlesticks, then the world of market movement only seems to open up that much more. I'd made the case for new highs back in late June, at a time when sentiment was particularly negative on not only the market but also the world in general. That case was based on a number of factors: from the technical picture provided by weekly charts, investor sentiment, and Elliott wave analysis. Whether the Standard & Poor's 500 manages to make those new highs remains an open question, but the S&P 500's more exclusive cousin, the S&P 100, has already done so. |
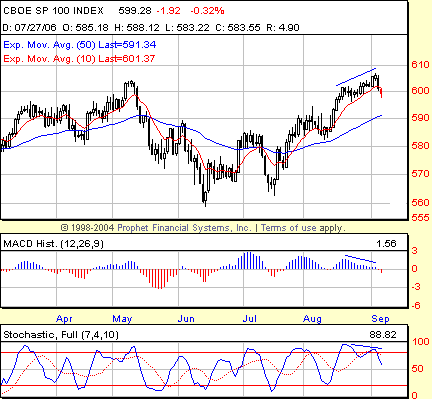
| The S&P 100, or $OEX, made a weekly closing high of 603.04 in early May. After a sharp May–July correction, the index bottomed and rallied strongly over the balance of the summer. By late August, the $OEX had retraced all of its summer losses and managed by the end of the month to actually eke out a new yearly high. However, the failure, thus far, of the $OEX to follow through to the upside in early September has put the staying power of the rally from the summer lows in doubt (see Figure 2). |

|
| FIGURE 2: S&P 100, DAILY. The potential for weakness displayed in the weekly chart shows up here in the daily as negative divergences in both the stochastic and the MACD histogram. At minimum, a correction to the 50-day exponential moving average (in blue) seems likely at this point. |
| Graphic provided by: Prophet Financial, Inc. |
| |
| The name of that doubt is the 2B top. Introduced by Victor Sperandeo in his book Methods Of A Wall Street Master, the 2B top (and its corollary, the 2B bottom) is one of the best ways for traders and speculators to not only catch a change of trend, but to do so at close to the earliest point possible. While many top- and bottom-picking strategies require multiple steps and confirmations, the 2B top is very simple in application and often very generous in its rewards to those market players who have the money management discipline to trade the setup properly. |
Writes Sperandeo on the subject of trading the 2B the right way:When trading the 2B criterion, it is essential that you admit defeat quickly if the trade moves against you. For example, if you are day-trading and you short the market on a 2B and then the market rallies to new highs again, you should immediately close your position when prices break past the new 2B high. To my way of looking at it, the distance between the May high and the August high put this potential 2B top in the "intermediate" camp. As such, the potential downside implications should be taken seriously. Sperandeo suggests a short entry in a 2B top scenario at the level of the low of the initial, earlier high. If you wanted to use the weekly closing high, then the short entry would be between 595 and 590. If you wanted to use the intraweek closing high, then the short entry would be based on the following weekly session and its low just south of 590. |
Technical Writer for Technical Analysis of STOCKS & COMMODITIES magazine, Working-Money.com, and Traders.com Advantage.
| Title: | Technical Writer |
| Company: | Technical Analysis, Inc. |
| Address: | 4757 California Avenue SW |
| Seattle, WA 98116 | |
| Phone # for sales: | 206 938 0570 |
| Fax: | 206 938 1307 |
| Website: | www.Traders.com |
| E-mail address: | DPenn@traders.com |
Traders' Resource Links | |
| Charting the Stock Market: The Wyckoff Method -- Books | |
| Working-Money.com -- Online Trading Services | |
| Traders.com Advantage -- Online Trading Services | |
| Technical Analysis of Stocks & Commodities -- Publications and Newsletters | |
| Working Money, at Working-Money.com -- Publications and Newsletters | |
| Traders.com Advantage -- Publications and Newsletters | |
| Professional Traders Starter Kit -- Software | |
Click here for more information about our publications!
Comments
Date: 09/07/06Rank: 3Comment:
Date: 09/09/06Rank: 4Comment: Article was great. But the Traders.com website needs a redesigned desperately.
1) full of low-legibility serif fonts often in small type sizes (should use san-serif fonts like verdana or arial).
2) poor use of color and graphics
3) poor organization
4) inconsistent page design and poor formatting of text blocks
Great info but poor design and presentation. It really doesn t pay in the long run to short-shift one s online presence with unprofessional execution.

Request Information From Our Sponsors
- StockCharts.com, Inc.
- Candle Patterns
- Candlestick Charting Explained
- Intermarket Technical Analysis
- John Murphy on Chart Analysis
- John Murphy's Chart Pattern Recognition
- John Murphy's Market Message
- MurphyExplainsMarketAnalysis-Intermarket Analysis
- MurphyExplainsMarketAnalysis-Visual Analysis
- StockCharts.com
- Technical Analysis of the Financial Markets
- The Visual Investor
- VectorVest, Inc.
- Executive Premier Workshop
- One-Day Options Course
- OptionsPro
- Retirement Income Workshop
- Sure-Fire Trading Systems (VectorVest, Inc.)
- Trading as a Business Workshop
- VectorVest 7 EOD
- VectorVest 7 RealTime/IntraDay
- VectorVest AutoTester
- VectorVest Educational Services
- VectorVest OnLine
- VectorVest Options Analyzer
- VectorVest ProGraphics v6.0
- VectorVest ProTrader 7
- VectorVest RealTime Derby Tool
- VectorVest Simulator
- VectorVest Variator
- VectorVest Watchdog
