

HOT TOPICS LIST
- MACD
- Fibonacci
- RSI
- Gann
- ADXR
- Stochastics
- Volume
- Triangles
- Futures
- Cycles
- Volatility
- ZIGZAG
- MESA
- Retracement
- Aroon
INDICATORS LIST
LIST OF TOPICS
PRINT THIS ARTICLE
by Arthur Hill
Apple has formed a potentially bearish harami, and traders should watch the relative strength index to confirm this pattern.
Position: Hold
Arthur Hill
Arthur Hill is currently editor of TDTrader.com, a website specializing in trading strategies, sector/industry specific breadth stats and overall technical analysis. He passed the Society of Technical Analysts (STA London) diploma exam with distinction is a Certified Financial Technician (CFTe). Prior to TD Trader, he was the Chief Technical Analyst for Stockcharts.com and the main contributor to the ChartSchool.
PRINT THIS ARTICLE
CANDLESTICK CHARTING
A Harami And Divergence For Apple
09/07/06 07:55:18 AMby Arthur Hill
Apple has formed a potentially bearish harami, and traders should watch the relative strength index to confirm this pattern.
Position: Hold
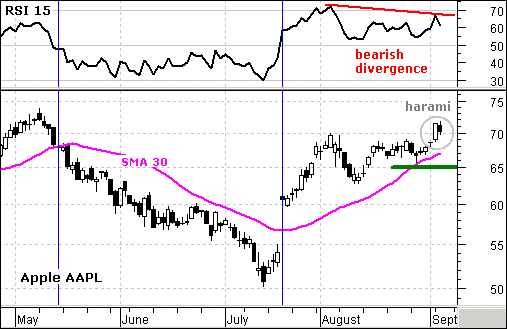
| The harami is a bearish candlestick pattern made up of two candlesticks, the first of which is a long white candlestick and the second is a smaller black candlestick that fits inside the long white candlestick (gray circle, Figure 1). The long white candlestick affirms the current trend. The smaller black candlestick forms with a weak open and weak close. This shows sudden indecision and could foreshadow a trend change. |
|
| FIGURE 1: APPLE COMPUTER. A move below 50 would confirm the bearish divergence and could be used to confirm the potentially bearish harami. |
| Graphic provided by: MetaStock. |
| |
| The harami alone is not enough to forecast a trend change, and it is best to look for confirmation. On the price chart for Apple Computer (AAPL), I am watching the 30-day moving average and the late August low. The stock broke below the 30-day moving average in May, and this led to a substantial fall. The July break back above the moving average led to a nice advance. Just below the moving average, the late August low established support at 65. A move below 65 would break the 30-day moving average and this low. Such a move would confirm the harami and call for a short-term reversal. |
| For indicators, I like to use the relative strength index (RSI) to confirm a short-term trend reversal. The 15-period RSI broke below 50 in May and this confirmed a downtrend that lasted about two months. The indicator then broke above 50 in July to confirm an uptrend that has lasted about one and a half months. The RSI formed a lower high in early September and a bearish divergence is taking shape. A move below 50 would confirm the bearish divergence and could be used to confirm the potentially bearish harami. |
Arthur Hill is currently editor of TDTrader.com, a website specializing in trading strategies, sector/industry specific breadth stats and overall technical analysis. He passed the Society of Technical Analysts (STA London) diploma exam with distinction is a Certified Financial Technician (CFTe). Prior to TD Trader, he was the Chief Technical Analyst for Stockcharts.com and the main contributor to the ChartSchool.
| Title: | Editor |
| Company: | TDTrader.com |
| Address: | Willem Geetsstraat 17 |
| Mechelen, B2800 | |
| Phone # for sales: | 3215345465 |
| Website: | www.tdtrader.com |
| E-mail address: | arthurh@tdtrader.com |
Traders' Resource Links | |
| TDTrader.com has not added any product or service information to TRADERS' RESOURCE. | |
Click here for more information about our publications!
Comments
Date:�09/07/06Rank:�4Comment:�

Request Information From Our Sponsors
- StockCharts.com, Inc.
- Candle Patterns
- Candlestick Charting Explained
- Intermarket Technical Analysis
- John Murphy on Chart Analysis
- John Murphy's Chart Pattern Recognition
- John Murphy's Market Message
- MurphyExplainsMarketAnalysis-Intermarket Analysis
- MurphyExplainsMarketAnalysis-Visual Analysis
- StockCharts.com
- Technical Analysis of the Financial Markets
- The Visual Investor
- VectorVest, Inc.
- Executive Premier Workshop
- One-Day Options Course
- OptionsPro
- Retirement Income Workshop
- Sure-Fire Trading Systems (VectorVest, Inc.)
- Trading as a Business Workshop
- VectorVest 7 EOD
- VectorVest 7 RealTime/IntraDay
- VectorVest AutoTester
- VectorVest Educational Services
- VectorVest OnLine
- VectorVest Options Analyzer
- VectorVest ProGraphics v6.0
- VectorVest ProTrader 7
- VectorVest RealTime Derby Tool
- VectorVest Simulator
- VectorVest Variator
- VectorVest Watchdog