HOT TOPICS LIST
- MACD
- Fibonacci
- RSI
- Gann
- ADXR
- Stochastics
- Volume
- Triangles
- Futures
- Cycles
- Volatility
- ZIGZAG
- MESA
- Retracement
- Aroon
INDICATORS LIST
LIST OF TOPICS
PRINT THIS ARTICLE
by David Penn
Sometimes the only thing worse than contrary indicators are contrary adages.
Position: N/A
David Penn
Technical Writer for Technical Analysis of STOCKS & COMMODITIES magazine, Working-Money.com, and Traders.com Advantage.
PRINT THIS ARTICLE
Natural Gas Bulls and Bears
09/29/00 02:54:45 PMby David Penn
Sometimes the only thing worse than contrary indicators are contrary adages.
Position: N/A
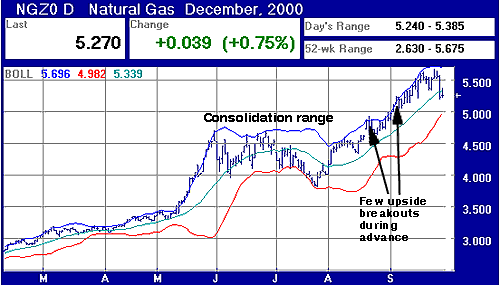
| Up, up goes natural gas. In a fashion similar to its crude oil cousin, natural gas prices broke out of a two-month, summer consolidation range to reach 52-week highs in mid-September. And while government intervention appears to have taken some of the bite out of rising oil prices (at least for now), there are real questions as to whether or not natural gas--which is increasingly responsible for powering electric plants--has reached or is near a top. |
| There are two contrasting philosophies about the price action natural gas has exhibited since August. The first theory suggests that it is very dangerous to try and play the bull with a tradable that is at historic highs. The thinking behind this notion is that beyond historic highs lie a universe of unpredictability; there is often good reason why prices have climbed to a certain point and failed to progress further (for some traders, the fact that historic highs exist in the first place is reason enough to avoid tradables that venture into this territory). |

|
| |
| However, a second theory suggests that historic highs exist because previous historic highs were in fact exceeded. To traders embracing this approach, no market climb is ever rejected out of hand as "too high". One strategy that incorporates this "ain't no mountain high enough" attitude involves specifically searching out those tradables that are at or approaching new highs--even all-time highs. Although most who employ this approach require the formation of a strong consolidation period in advance of a significant climb before going long, sometimes a clear chart pattern such as a flag is enough to make a stop-loss protected trade on the long side. |
| Taking a look at the December natural gas futures contract, we are able to see clearly the consolidation range that developed over the summer between 4.500 and 4.000. Equally clear is the two-month climb from just under 4.500 at the beginning of August to just over 5.500 near the end of September. Using Bollinger bands to gauge for price extremes suggests that, sometimes, bullishness knows few boundaries. During the May climb, prices hugged the upper band tightly, rarely breaking through on the upside, but nonetheless effectively driving prices up 35% during the month of May. Similarly, the August/September climb saw prices riding the upper Bollinger band almost as tightly as during the May advance, and the August/September climb also saw no upside breakouts beyond the upper band. |
| The most salient aspect of the Bollinger band is that they are placed at two standard deviations from the price action, meaning that 95% of the price movement will fall between the upper and lower bands. During a consolidating market, some traders plot to sell the upper band and buy the lower band. However, in trending markets, traders often look for upside or downside breakouts beyond the bands (i.e., upside or downside price extremes) in the hopes of trading in the direction of the anticipated correction. The absence of upside Bollinger band breakouts in the December natural gas futures contract suggests that the current prices, though near historic highs, are not necessarily extreme from a trading perspective. While this does not mean that natural gas prices will continue climbing, this "containment" does seem to support the notion that bull markets can often push limits to new places without breaking them. |
Technical Writer for Technical Analysis of STOCKS & COMMODITIES magazine, Working-Money.com, and Traders.com Advantage.
| Title: | Technical Writer |
| Company: | Technical Analysis, Inc. |
| Address: | 4757 California Avenue SW |
| Seattle, WA 98116 | |
| Phone # for sales: | 206 938 0570 |
| Fax: | 206 938 1307 |
| Website: | www.Traders.com |
| E-mail address: | DPenn@traders.com |
Traders' Resource Links | |
| Charting the Stock Market: The Wyckoff Method -- Books | |
| Working-Money.com -- Online Trading Services | |
| Traders.com Advantage -- Online Trading Services | |
| Technical Analysis of Stocks & Commodities -- Publications and Newsletters | |
| Working Money, at Working-Money.com -- Publications and Newsletters | |
| Traders.com Advantage -- Publications and Newsletters | |
| Professional Traders Starter Kit -- Software | |
Click here for more information about our publications!
Comments

Request Information From Our Sponsors
- VectorVest, Inc.
- Executive Premier Workshop
- One-Day Options Course
- OptionsPro
- Retirement Income Workshop
- Sure-Fire Trading Systems (VectorVest, Inc.)
- Trading as a Business Workshop
- VectorVest 7 EOD
- VectorVest 7 RealTime/IntraDay
- VectorVest AutoTester
- VectorVest Educational Services
- VectorVest OnLine
- VectorVest Options Analyzer
- VectorVest ProGraphics v6.0
- VectorVest ProTrader 7
- VectorVest RealTime Derby Tool
- VectorVest Simulator
- VectorVest Variator
- VectorVest Watchdog
- StockCharts.com, Inc.
- Candle Patterns
- Candlestick Charting Explained
- Intermarket Technical Analysis
- John Murphy on Chart Analysis
- John Murphy's Chart Pattern Recognition
- John Murphy's Market Message
- MurphyExplainsMarketAnalysis-Intermarket Analysis
- MurphyExplainsMarketAnalysis-Visual Analysis
- StockCharts.com
- Technical Analysis of the Financial Markets
- The Visual Investor
