HOT TOPICS LIST
- MACD
- Fibonacci
- RSI
- Gann
- ADXR
- Stochastics
- Volume
- Triangles
- Futures
- Cycles
- Volatility
- ZIGZAG
- MESA
- Retracement
- Aroon
INDICATORS LIST
LIST OF TOPICS
PRINT THIS ARTICLE
by Koos van der Merwe
What is going on with Rambus?
Position: Accumulate
Koos van der Merwe
Has been a technical analyst since 1969, and has worked as a futures and options trader with First Financial Futures in Johannesburg, South Africa.
PRINT THIS ARTICLE
OSCILLATORS
Is Rambus A Buy?
09/05/06 11:55:13 AMby Koos van der Merwe
What is going on with Rambus?
Position: Accumulate
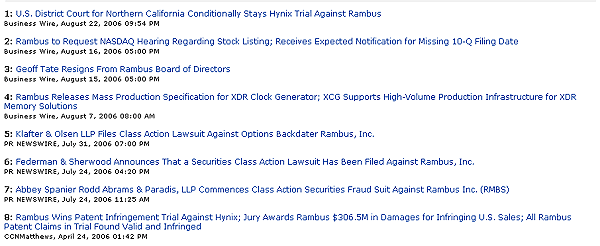
| Rambus, Inc., designs, develops, licenses, and markets high-speed chip-to-chip interface technology to enhance the performance and cost-effectiveness of computers, consumer electronics, and other electronic systems. The company licenses semiconductor companies to manufacture and sell memory and logic integrated circuits incorporating Rambus interface technology and markets its solution to systems companies to encourage them to design Rambus interface technology into their products. A good product, and competitive with the giant Intel, but recently, news reports have not been that scintillating about it (see Figure 1). |

|
| FIGURE 1: NEWS ON RAMBUS. The news reports on RMBS did not look encouraging. |
| Graphic provided by: Various news wires. |
| |
| So... what do the charts tell us? |

|
| |
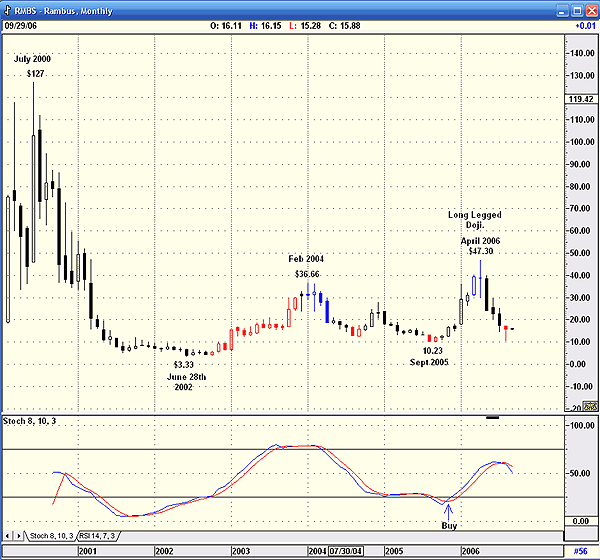
| Figure 2 is a monthly chart showing how the stock price fell from the highs of the bubble in June 2000 to the depths of despair by June 28, 2002, a loss of 97.38%. The recovery to $36.66 looked promising but the correction that followed was discouraging as the price fell to $10.23, but the double bottom that formed and the rise to $47.30 by April 2006 looked extremely encouraging. Then the stock started falling in May as investors took profits on a long-legged doji candlestick, an indicator of indecision at market tops, which usually leads to a reversal. My preferred stochastic indicator, with the parameters 8,10,3, did give a buy signal on November 30, but it seems to be hesitating looking for direction. |

|
| |
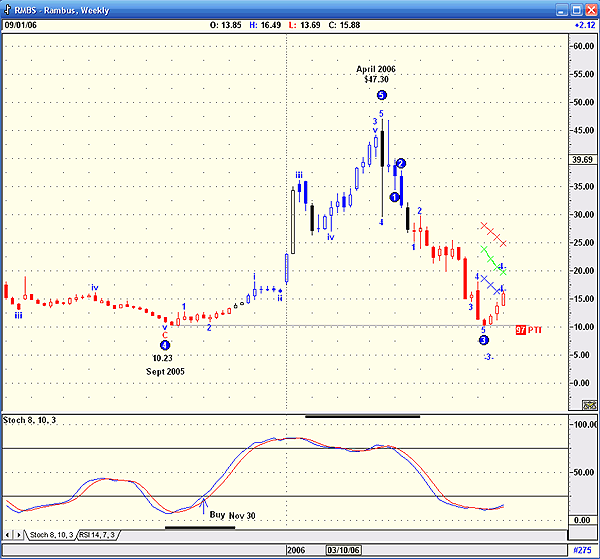
| Figure 3 shows how Rambus fell from the high of $47.30 to retest the low of $10.23. Does the double bottom that has formed suggest a substantial rise in the price? The past three weeks look encouraging, especially with an oversold stochastic, but the Elliott wave count suggested by the AdvancedGET program is suggesting that there is a 97% probability that a fourth wave will be completed soon, with a fifth wave fall to zero. |

|
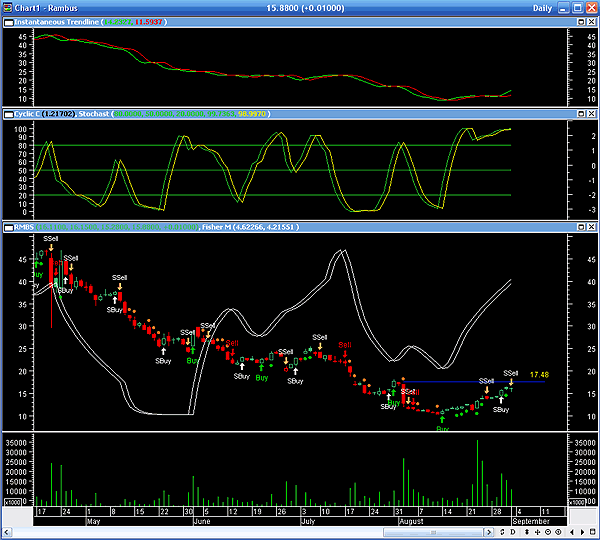
| FIGURE 4: RAMBUS. This short-term analysis gives insight to what else may be in store for RMBS. |
| Graphic provided by: MetaStock. |
| |
| This does seem highly unlikely. For better clarification, I turn to a short-term analysis using MetaStock (Figure 4) and the following indicators: 1. Fisher formula of the moving average convergence/divergence (MACD) 2. Stochastic relative strength index (RSI) of the cumulative cycle as suggested by John Ehlers 3. Instantaneous trendline as suggested by John Ehlers. Both the Fisher MACD indicator and the instantaneous trendline are bullish, but the stochastic RSI has given a short-term sell signal but on falling volume, which could be a sign of strength. A cup & handle formation also appears to be developing, with a move above $17.48 being a signal to buy the share. To conclude, we should never buy or own a share with a legal guillotine on its neck, as does Rambus, but the news report of August 22 and the stock price rising to test the $17.48 level tell us that this is a share we should not discard. Do keep an eye on Rambus. It may still surprise us, and pleasantly. |
Has been a technical analyst since 1969, and has worked as a futures and options trader with First Financial Futures in Johannesburg, South Africa.
| Address: | 3256 West 24th Ave |
| Vancouver, BC | |
| Phone # for sales: | 6042634214 |
| E-mail address: | petroosp@gmail.com |
Click here for more information about our publications!
Comments
Date: 09/06/06Rank: 2Comment:
Date: 09/08/06Rank: 2Comment: exactly what is the comp of the fischer mac-d?

Request Information From Our Sponsors
- StockCharts.com, Inc.
- Candle Patterns
- Candlestick Charting Explained
- Intermarket Technical Analysis
- John Murphy on Chart Analysis
- John Murphy's Chart Pattern Recognition
- John Murphy's Market Message
- MurphyExplainsMarketAnalysis-Intermarket Analysis
- MurphyExplainsMarketAnalysis-Visual Analysis
- StockCharts.com
- Technical Analysis of the Financial Markets
- The Visual Investor
- VectorVest, Inc.
- Executive Premier Workshop
- One-Day Options Course
- OptionsPro
- Retirement Income Workshop
- Sure-Fire Trading Systems (VectorVest, Inc.)
- Trading as a Business Workshop
- VectorVest 7 EOD
- VectorVest 7 RealTime/IntraDay
- VectorVest AutoTester
- VectorVest Educational Services
- VectorVest OnLine
- VectorVest Options Analyzer
- VectorVest ProGraphics v6.0
- VectorVest ProTrader 7
- VectorVest RealTime Derby Tool
- VectorVest Simulator
- VectorVest Variator
- VectorVest Watchdog
