

HOT TOPICS LIST
- MACD
- Fibonacci
- RSI
- Gann
- ADXR
- Stochastics
- Volume
- Triangles
- Futures
- Cycles
- Volatility
- ZIGZAG
- MESA
- Retracement
- Aroon
INDICATORS LIST
LIST OF TOPICS
PRINT THIS ARTICLE
by Arthur Hill
Trading in the US Dollar Index has turned mighty boring the last few weeks, and this could foreshadow some fireworks in the near future.
Position: Hold
Arthur Hill
Arthur Hill is currently editor of TDTrader.com, a website specializing in trading strategies, sector/industry specific breadth stats and overall technical analysis. He passed the Society of Technical Analysts (STA London) diploma exam with distinction is a Certified Financial Technician (CFTe). Prior to TD Trader, he was the Chief Technical Analyst for Stockcharts.com and the main contributor to the ChartSchool.
PRINT THIS ARTICLE
AVERAGE TRUE RANGE
US Dollar Gets Boring
09/05/06 09:31:07 AMby Arthur Hill
Trading in the US Dollar Index has turned mighty boring the last few weeks, and this could foreshadow some fireworks in the near future.
Position: Hold
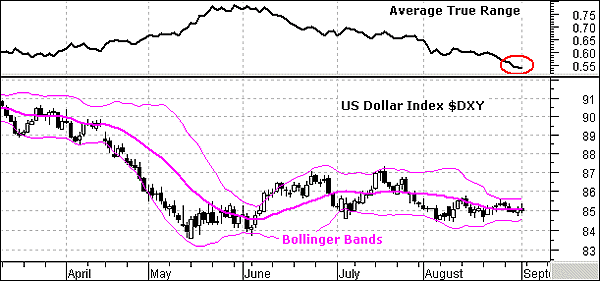
| Two indicators confirm that trading in the US Dollar Index slowed to a crawl in August. The 20-day average true range (ATR) moved to its lowest level of the year, and Bollinger Bands have narrowed significantly. Both indicators reflect volatility (Figure 1). As its name implies, ATR uses the high, low, and close to measure the price range over a given time period. I am using 20 days and this equates to four weeks. The lower the ATR is, the tighter the price range and less the volatility. |
|
| FIGURE 1: US DOLLAR INDEX AND THE AVERAGE TRUE RANGE. Trading in the US Dollar Index has slowed significantly and the average true range has moved to its lowest level of the year. |
| Graphic provided by: MetaStock. |
| |
| Narrowing Bollinger Bands further affirm lower volatility. Bollinger Bands contracted over the last few weeks, and this signals a volatility contraction. This is like the calm before the storm, as such volatility contractions often precede breakouts. Traders should watch support and resistance for the next signal. |
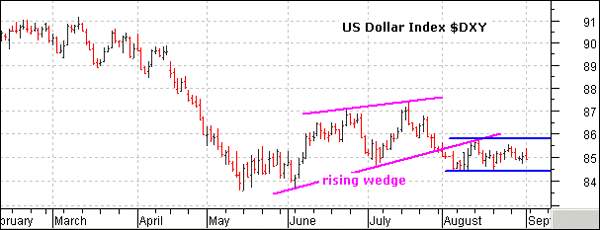
| Focusing on the price chart (Figure 2), the US Dollar Index broke rising wedge support in early August, and this trendline break is holding. There was a small bounce after the break, but the index remains below 86 and I consider this break to be bearish. |
|
| FIGURE 2: US DOLLAR INDEX AND THE RISING WEDGE. The index broke rising wedge support. |
| Graphic provided by: MetaStock. |
| |
| The index has since formed a consolidation over the last few weeks, with support at 84.39 and resistance at 85.75. Looking at price action since mid-July, we can see a sharp decline and then a flat consolidation. A break below these consolidation lows would signal a continuation lower and further the downtrend. Conversely, a break above the consolidation high would be bullish and I would then expect more gains. |
Arthur Hill is currently editor of TDTrader.com, a website specializing in trading strategies, sector/industry specific breadth stats and overall technical analysis. He passed the Society of Technical Analysts (STA London) diploma exam with distinction is a Certified Financial Technician (CFTe). Prior to TD Trader, he was the Chief Technical Analyst for Stockcharts.com and the main contributor to the ChartSchool.
| Title: | Editor |
| Company: | TDTrader.com |
| Address: | Willem Geetsstraat 17 |
| Mechelen, B2800 | |
| Phone # for sales: | 3215345465 |
| Website: | www.tdtrader.com |
| E-mail address: | arthurh@tdtrader.com |
Traders' Resource Links | |
| TDTrader.com has not added any product or service information to TRADERS' RESOURCE. | |
Click here for more information about our publications!
Comments
Date:�09/05/06Rank:�4Comment:�
Date:�09/12/06Rank:�4Comment:�

Request Information From Our Sponsors
- StockCharts.com, Inc.
- Candle Patterns
- Candlestick Charting Explained
- Intermarket Technical Analysis
- John Murphy on Chart Analysis
- John Murphy's Chart Pattern Recognition
- John Murphy's Market Message
- MurphyExplainsMarketAnalysis-Intermarket Analysis
- MurphyExplainsMarketAnalysis-Visual Analysis
- StockCharts.com
- Technical Analysis of the Financial Markets
- The Visual Investor
- VectorVest, Inc.
- Executive Premier Workshop
- One-Day Options Course
- OptionsPro
- Retirement Income Workshop
- Sure-Fire Trading Systems (VectorVest, Inc.)
- Trading as a Business Workshop
- VectorVest 7 EOD
- VectorVest 7 RealTime/IntraDay
- VectorVest AutoTester
- VectorVest Educational Services
- VectorVest OnLine
- VectorVest Options Analyzer
- VectorVest ProGraphics v6.0
- VectorVest ProTrader 7
- VectorVest RealTime Derby Tool
- VectorVest Simulator
- VectorVest Variator
- VectorVest Watchdog