HOT TOPICS LIST
- MACD
- Fibonacci
- RSI
- Gann
- ADXR
- Stochastics
- Volume
- Triangles
- Futures
- Cycles
- Volatility
- ZIGZAG
- MESA
- Retracement
- Aroon
INDICATORS LIST
LIST OF TOPICS
PRINT THIS ARTICLE
by Paolo Pezzutti
A distribution phase might be ongoing on the HOLDRS, but the trend is very strong in the long term, and risk has to be strictly controlled.
Position: N/A
Paolo Pezzutti
Author of the book "Trading the US Markets - A Comprehensive Guide to US Markets for International Traders and Investors" - Harriman House (July 2008)
PRINT THIS ARTICLE
TECHNICAL ANALYSIS
AMEX Oil Service HOLDRS Index: Moving Sideways
09/05/06 03:02:47 PMby Paolo Pezzutti
A distribution phase might be ongoing on the HOLDRS, but the trend is very strong in the long term, and risk has to be strictly controlled.
Position: N/A
| The nuclear standoff between Iran and the western nations has intensified with Tehran's refusal to stop enriching uranium for its nuclear program. Nonetheless, the Index prices posted a loss of about 19% since last May's top at 169.74. A report shows ample US petroleum supplies. The crude oil supply is now 19.5 million barrels more than a year ago and imports are at their highest levels since July 2004, but concerns about the potential risk to oil supplies stemming from the dispute between Iran and western nations continues to limit any losses in the oil market. A report from the International Atomic Energy Agency said that Iran shows no signs of freezing uranium enrichment, the Associated Press reported. The news clears the way for the United Nations Security Council to impose economic or political sanctions against the Middle Eastern nation, althogh Iran continues to keep a door open for negotiations. Meanwhile, Nigerian oil workers have voted to strike in protest at poor security in the Niger Delta, following the death of a Royal Dutch Shell oil worker. Foreign oil workers have been taken hostage in the oil-rich region in recent months by various groups that are seeking to keep more of Nigeria's oil money within the country. A look at the larger picture with the elimination of hurricane threats as each week passes indicates the market should bring prices lower. The expectation for a firm rather than soft economic landing should also help send prices down. This last consideration is the most significant element that could favor an oil price reduction. |
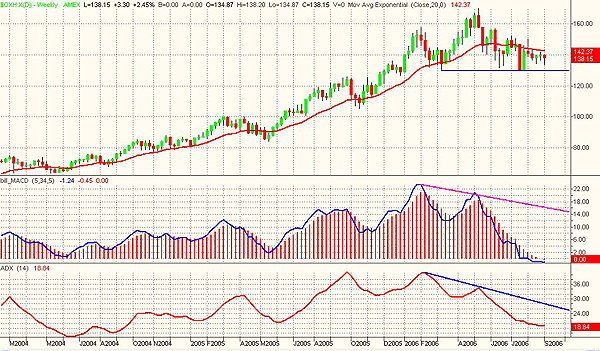
| On the technical side, you can see in Figure 1 the weekly time frame of the HOLDRS. During the past two years, prices have printed an extraordinary uptrend moving from the level of 65 to the top printed in May 2006 above 165. Note that both the moving average convergence/divergence (MACD) and the average directional movement index (ADX), in coincidence with the May high, printed a significant negative divergence. The following weakness has brought to print new lows since 2003 and the ADX to the 18.84, which indicates at least a pause in the long-term uptrend. The level of 130 is now an important support in this time frame. |

|
| FIGURE 1: OIL SERVICE HOLDRS, WEEKLY. The Oil Service HOLDRS has developed negative divergences of the MACD and the ADX in coincidence with the May top. The ongoing correction has brought the MACD to print new lows since 2003. The support of 130 is now important to see price resume the uptrend and retest previous highs. |
| Graphic provided by: TradeStation. |
| |
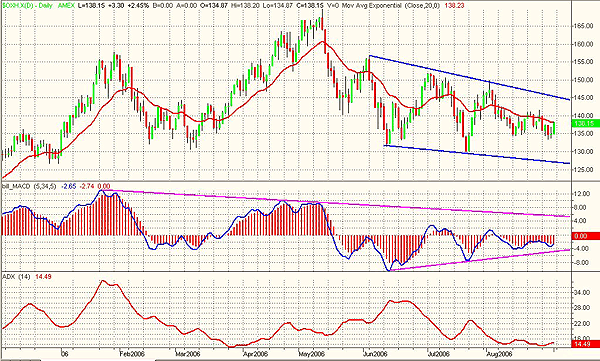
| In the daily time frame (Figure 2), prices are moving sideways. The breakout of the support of 130 would project prices to the 110 area. Also in this time frame, you can see how the MACD printed a negative divergence in coincidence with the May top. The ADX, at 14.49 displays the lack of trend. The MACD has printed a positive divergence at the end of July when testing the 130 support, but momentum, so far, is very low to assess that the Index has enough strength to resume the uptrend. |

|
| FIGURE 2: OIL SERVICES, DAILY. The MACD and ADX indicators display the ongoing lack of trendiness. Applying breakout techniques in this situation might be a viable option. |
| Graphic provided by: TradeStation. |
| |
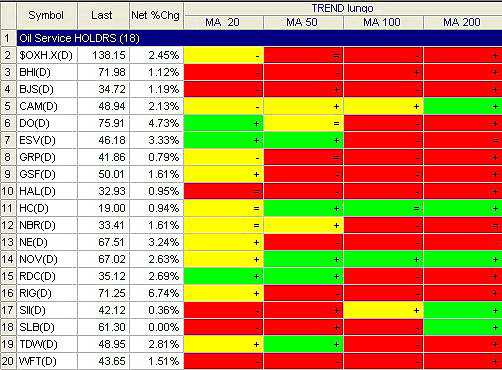
| In Figure 3, you can see the trend conditions of the stocks making up HOLDRS. I used the 20-, 50-, 100-, and 200-day- moving average of the close. The background is green when the close is > than the moving average; red when it is below and yellow when it crosses. Plus and minus indicate the slope of the moving average. You can see that there are no stocks with the close above all the moving averages. Most of them are negatively positioned with regards to the longer-term moving averages (100 and 200 days). Note also that last Friday many stocks printed significant performances, that so far, has not changed their general conditions. |

|
| FIGURE 3: TREND CONDITIONS. The trend conditions of the stocks composing the HOLDRS display negative conditions, especially with regards to the longer-term moving averages (100 and 200) days. |
| Graphic provided by: TradeStation. |
| |
| Normally, these types of moves represent a distribution phase. Anticipating a breakout to the downside is an option, but it would require strict risk control. In fact, given the strong long-term uptrend of oil, the risk is high. On the other hand, applying breakout techniques might limit risk in these conditions. You would enter your short at lower prices, but volatility should increase significantly in case of a breakout and a new trend would emerge, at least at the daily level, providing you with enough space to make a profit. Another option could be to select the technically weakest stocks composing the HOLDRS to identify those with more potential in case of a downtrend or have already started a down move and open short positions. Should the HOLDRS move above the 150 level, it would be likely to see a retest of the May high. |
Author of the book "Trading the US Markets - A Comprehensive Guide to US Markets for International Traders and Investors" - Harriman House (July 2008)
| Address: | VIA ROBERTO AGO 26 POSTAL CODE 00166 |
| Rome, ITALY | |
| Phone # for sales: | +393357540708 |
| E-mail address: | pezzutti.paolo@tiscali.it |
Click here for more information about our publications!
Comments
Date: 09/05/06Rank: 3Comment:
Date: 09/06/06Rank: 4Comment:

Request Information From Our Sponsors
- StockCharts.com, Inc.
- Candle Patterns
- Candlestick Charting Explained
- Intermarket Technical Analysis
- John Murphy on Chart Analysis
- John Murphy's Chart Pattern Recognition
- John Murphy's Market Message
- MurphyExplainsMarketAnalysis-Intermarket Analysis
- MurphyExplainsMarketAnalysis-Visual Analysis
- StockCharts.com
- Technical Analysis of the Financial Markets
- The Visual Investor
- VectorVest, Inc.
- Executive Premier Workshop
- One-Day Options Course
- OptionsPro
- Retirement Income Workshop
- Sure-Fire Trading Systems (VectorVest, Inc.)
- Trading as a Business Workshop
- VectorVest 7 EOD
- VectorVest 7 RealTime/IntraDay
- VectorVest AutoTester
- VectorVest Educational Services
- VectorVest OnLine
- VectorVest Options Analyzer
- VectorVest ProGraphics v6.0
- VectorVest ProTrader 7
- VectorVest RealTime Derby Tool
- VectorVest Simulator
- VectorVest Variator
- VectorVest Watchdog
