HOT TOPICS LIST
- MACD
- Fibonacci
- RSI
- Gann
- ADXR
- Stochastics
- Volume
- Triangles
- Futures
- Cycles
- Volatility
- ZIGZAG
- MESA
- Retracement
- Aroon
INDICATORS LIST
LIST OF TOPICS
PRINT THIS ARTICLE
by David Penn
An ascending triangle interrupts a rally in shares of Apple Computer. Is it the pause that refreshes?
Position: N/A
David Penn
Technical Writer for Technical Analysis of STOCKS & COMMODITIES magazine, Working-Money.com, and Traders.com Advantage.
PRINT THIS ARTICLE
TRIANGLES
The Apple Triangle
08/31/06 03:11:44 PMby David Penn
An ascending triangle interrupts a rally in shares of Apple Computer. Is it the pause that refreshes?
Position: N/A
| Far more often than not, consolidations in trends tend to lead not to reversals but to more trend. |

|
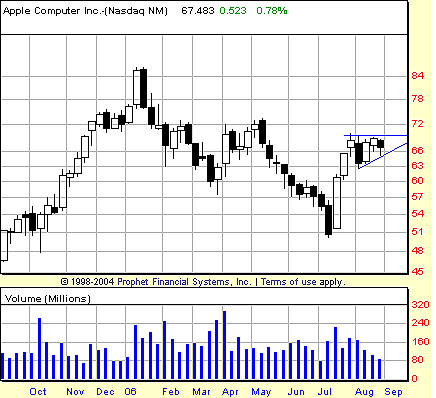
| FIGURE 1: APPLE COMPUTER, WEEKLY. This symmetrical triangle emerges after a strong move off the July lows. Note also the declining volume over the course of the pattern in August. |
| Graphic provided by: Prophet Financial, Inc. |
| |
| I've made this point repeatedly in recent articles when discussing symmetrical triangles in markets such as Google, copper, and sugar ("The Google Triangle," August 23; "The Copper Triangle" and "The Sugar Triangle," both from August 25). Ironically, in those instances, I was warning readers not about the possibility of these triangles ushering in renewed pushes higher, but about the very real chance that these symmetrical patterns represented tops. "The Sugar Triangle" in particular was presented to show just such a triangle-as-top scenario. |
| Although shares of Apple (AAPL) are moving toward a source of potential resistance near the 72 mark, my suspicion is that the triangle shown in Figure 1 is more likely to be the sort that leads to higher, rather than lower, prices. For one, compared to the symmetrical triangles in Google, copper, and sugar, this triangle is nowhere near the end of an extended rally. In addition, whereas those other triangles were symmetrical involving two converging trendlines, the triangle in Apple is of the ascending variety, in which a rising support trendline converges with a flat or horizontal resistance trendline. While such triangles can be failures, sending prices back downward whence they came, successful ascending triangles are often the harbinger of major price appreciation in the near term. |

|
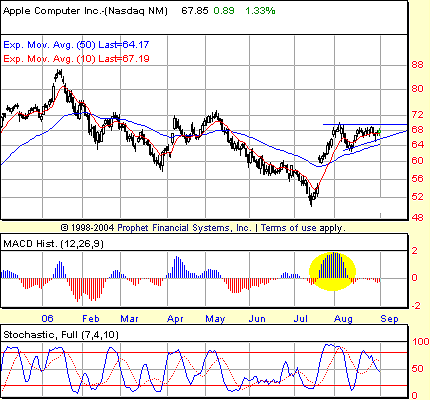
| FIGURE 2: APPLE COMPUTER, DAILY. The size of the moving average convergence/divergence (MACD) histogram during AAPL's bounce in late July is one sign that the price highs reached during the histogram peak will be exceeded. |
| Graphic provided by: Prophet Financial, Inc. |
| |
| It should be of little surprise that Apple would consolidate at these levels. There is virtually no resistance between 60 and 72, witnessed by the stock's ability to leap up from its July bottom near 50 to just above 60 and then continue on to just shy of 70 in roughly two weeks. The resistance comes in the form of the old correction highs in May, April, and even late February. It could be argued that consolidations like ascending triangles that tend to be especially bullish were built for breaking through the kind of resistance that Apple will be facing as it attempts to move higher. The combination of consistent resistance at the top of the pattern and steadily higher lows helps build up pressure, not unlike a coiled spring, that when released explodes into a frenzy of buying by those who doubted the upside potential of the pattern—or simply preferred waiting until that upside potential was confirmed by way of a breakout. See Figure 2. |
| What sort of upside potential are we talking about? The ascending triangle in Apple measures approximately six points, from a closing high of 70 to a closing low near 64. Adding those six points to the value at the top, the horizontal resistance level, suggests a minimum upside of 76 points over the next few weeks. Such a move would take out the May, April, and late February highs already mentioned, and give the stock a chance at taking on the even-higher January 2006 highs just shy of 87. As far as specific entries are concerned, my histochastic screen points to 68.67—as does the TRIX screen. The BOSO screen is especially interesting. While it has not produced a fresh buy signal recently, the buy signal it did offer back in late July at 63.87 has yet to be stopped out—even when the correction of early August brought Apple to as low as 63.59 on a closing basis. |
Technical Writer for Technical Analysis of STOCKS & COMMODITIES magazine, Working-Money.com, and Traders.com Advantage.
| Title: | Technical Writer |
| Company: | Technical Analysis, Inc. |
| Address: | 4757 California Avenue SW |
| Seattle, WA 98116 | |
| Phone # for sales: | 206 938 0570 |
| Fax: | 206 938 1307 |
| Website: | www.Traders.com |
| E-mail address: | DPenn@traders.com |
Traders' Resource Links | |
| Charting the Stock Market: The Wyckoff Method -- Books | |
| Working-Money.com -- Online Trading Services | |
| Traders.com Advantage -- Online Trading Services | |
| Technical Analysis of Stocks & Commodities -- Publications and Newsletters | |
| Working Money, at Working-Money.com -- Publications and Newsletters | |
| Traders.com Advantage -- Publications and Newsletters | |
| Professional Traders Starter Kit -- Software | |
Click here for more information about our publications!
Comments
Date: 09/02/06Rank: 3Comment:

|

Request Information From Our Sponsors
- StockCharts.com, Inc.
- Candle Patterns
- Candlestick Charting Explained
- Intermarket Technical Analysis
- John Murphy on Chart Analysis
- John Murphy's Chart Pattern Recognition
- John Murphy's Market Message
- MurphyExplainsMarketAnalysis-Intermarket Analysis
- MurphyExplainsMarketAnalysis-Visual Analysis
- StockCharts.com
- Technical Analysis of the Financial Markets
- The Visual Investor
- VectorVest, Inc.
- Executive Premier Workshop
- One-Day Options Course
- OptionsPro
- Retirement Income Workshop
- Sure-Fire Trading Systems (VectorVest, Inc.)
- Trading as a Business Workshop
- VectorVest 7 EOD
- VectorVest 7 RealTime/IntraDay
- VectorVest AutoTester
- VectorVest Educational Services
- VectorVest OnLine
- VectorVest Options Analyzer
- VectorVest ProGraphics v6.0
- VectorVest ProTrader 7
- VectorVest RealTime Derby Tool
- VectorVest Simulator
- VectorVest Variator
- VectorVest Watchdog
