HOT TOPICS LIST
- MACD
- Fibonacci
- RSI
- Gann
- ADXR
- Stochastics
- Volume
- Triangles
- Futures
- Cycles
- Volatility
- ZIGZAG
- MESA
- Retracement
- Aroon
INDICATORS LIST
LIST OF TOPICS
PRINT THIS ARTICLE
by Gary Grosschadl
The high-tech index hit a 2006 high of 2375 in April and then fell more than 300 points into the dog days of summer. Now an upleg is under way.
Position: Buy
Gary Grosschadl
Independent Canadian equities trader and technical analyst based in Peterborough
Ontario, Canada.
PRINT THIS ARTICLE
ANDREWS PITCH-FORK
Nasdaq Composite Breaks Overhead Resistance
08/30/06 03:56:02 PMby Gary Grosschadl
The high-tech index hit a 2006 high of 2375 in April and then fell more than 300 points into the dog days of summer. Now an upleg is under way.
Position: Buy
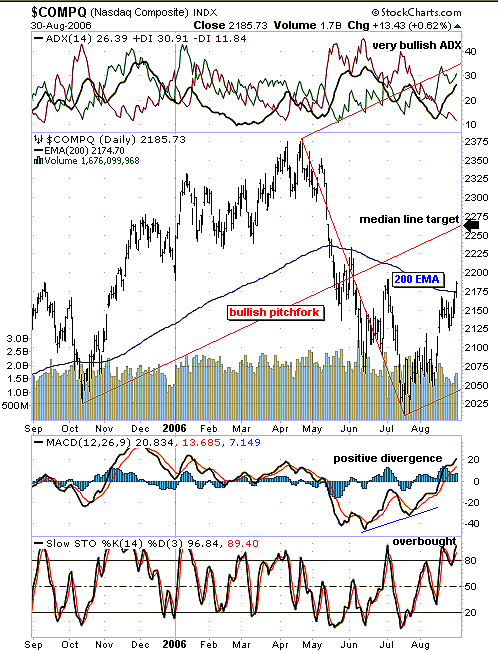
| As Figure 1 shows, the NASDAQ Composite has closed above the ever-important 200-day exponential moving average (EMA). The initial drop below this average last May confirmed a serious downleg was under way. Likewise, this fresh close above this moving average may signal a continued upleg. |
| An Andrews pitchfork is plotted using three major turning points. This method of determining support & resistance uses parallel lines. This upward-facing pitchfork remains bullish as long as the lower median line is not violated (currently near 2050). Pitchfork theory holds that a move to the median line is likely to be followed by an eventual move to the lower median line to test support. Under super bull conditions, a move above the median line can lead to a possible test of the upper median line. |

|
| FIGURE 1: NASDAQ COMPOSITE, DAILY. Here's a pitchfork on the NASDAQ Composite. |
| Graphic provided by: StockCharts.com. |
| |
| Several indicators are considered. At the top of the chart, the average directional movement index (ADX) line is in a very bullish mode being above 25 and upsloping between the DIs or directional indexes. This indicates a strong bullish trend. Below the chart, the moving average convergence/divergence (MACD) also shows a bullish stance having moved above the zero line. Note the previous positive divergence that foretold a coming rise. As the composite index made a lower low, the MACD went in the opposite direction. The stochastic oscillator shows a bullish high turn but reminds us that this is considered an overbought situation. However, if the trend is strong enough, this oscillator can "stick" high for an extended time. |
| In summary, the current trend is bullish and a likely upside target is the median line, currently near 2270. A close below the 200-day EMA would be bearish in the short term and could lead to a test of downside support at the lower tine of the pitchfork. |
Independent Canadian equities trader and technical analyst based in Peterborough
Ontario, Canada.
| Website: | www.whatsonsale.ca/financial.html |
| E-mail address: | gwg7@sympatico.ca |
Click here for more information about our publications!
Comments
Date: 09/01/06Rank: 3Comment:
Date: 09/02/06Rank: 5Comment:

Request Information From Our Sponsors
- StockCharts.com, Inc.
- Candle Patterns
- Candlestick Charting Explained
- Intermarket Technical Analysis
- John Murphy on Chart Analysis
- John Murphy's Chart Pattern Recognition
- John Murphy's Market Message
- MurphyExplainsMarketAnalysis-Intermarket Analysis
- MurphyExplainsMarketAnalysis-Visual Analysis
- StockCharts.com
- Technical Analysis of the Financial Markets
- The Visual Investor
- VectorVest, Inc.
- Executive Premier Workshop
- One-Day Options Course
- OptionsPro
- Retirement Income Workshop
- Sure-Fire Trading Systems (VectorVest, Inc.)
- Trading as a Business Workshop
- VectorVest 7 EOD
- VectorVest 7 RealTime/IntraDay
- VectorVest AutoTester
- VectorVest Educational Services
- VectorVest OnLine
- VectorVest Options Analyzer
- VectorVest ProGraphics v6.0
- VectorVest ProTrader 7
- VectorVest RealTime Derby Tool
- VectorVest Simulator
- VectorVest Variator
- VectorVest Watchdog
