HOT TOPICS LIST
- MACD
- Fibonacci
- RSI
- Gann
- ADXR
- Stochastics
- Volume
- Triangles
- Futures
- Cycles
- Volatility
- ZIGZAG
- MESA
- Retracement
- Aroon
INDICATORS LIST
LIST OF TOPICS
PRINT THIS ARTICLE
by David Penn
Breakouts above a three-month downtrend line and a one-month uptrend line are positives.
Position: N/A
David Penn
Technical Writer for Technical Analysis of STOCKS & COMMODITIES magazine, Working-Money.com, and Traders.com Advantage.
PRINT THIS ARTICLE
TREND-CHANNEL
Two Bullish Breaks For The NASDAQ 100
08/30/06 11:59:21 AMby David Penn
Breakouts above a three-month downtrend line and a one-month uptrend line are positives.
Position: N/A
| I remain fascinated by the world of technical charting sans indicators. I haven't forsaken my moving average convergence/divergence (MACD) histogram, or my 7,10 stochastic or my BOSO setups. But we should never become so enamored with our indicators and oscillators that a simple price and volume chart leaves us cold. |

|
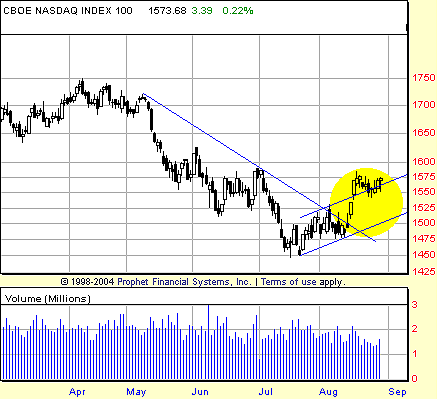
| FIGURE 1: NASDAQ 100, DAILY. Breaking out above the downtrend line from the high in early May was good for the NASDAQ 100. But breaking out above the uptrend line from the low in mid-July might turn out to be even better. |
| Graphic provided by: Prophet Financial, Inc. |
| |
| In the past few months since I've been focusing on price and volume alone, many times I've come across charts that didn't look like they held much opportunity, only to find myself coming up with possible entries and exits when I slapped on my BOSO screen or my histochastic screen. That has given me some pause and made me wonder if the ability of the indicators to squeeze out the sheerest trade opportunity from even the most uninspiring chart might be a curse in disguise. Now, if I don't see a decent opportunity with price and volume alone, I tend to skip that chart and not go in with the "precision instruments" until I find a price and volume chart that is more appealing. |
| The chart of the NASDAQ 100 in Figure 1 is a good example of how apparent opportunities can be even without complex indicators. We have a downtrend line that begins in May and extends to and through the lowest high immediately before the lowest low in July. The July bottom leads to a rally that has the NASDAQ 100 breaking out above the downtrend line on a closing basis in mid-August. While this does set up the opportunity for a 1-2-3 trend reversal, we note that rather than coming back down to test the July low—as would be watched for as stage 2 of a 1-2-3 trend reversal—the NASDAQ 100 has instead moved sideways over the course of the second half of August. |

|
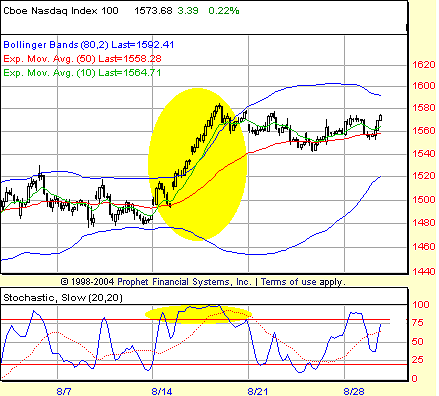
| FIGURE 2: NASDAQ 100, HOURLY. The stochastic breakout shown in this BOSO screen from mid-August led to significant gains over a relatively short period of time. Moving toward September, it appears as if a similar opportunity may be developing should the $NDX again become overbought based on the stochastic. |
| Graphic provided by: Prophet Financial, Inc. |
| |
| One of the best things a market can do when coming off a bottom is to break out beyond the initial trend channel that extends from the lows. This kind of move shows real strength and determination on the part of buyers to accumulate shares, particularly when such a break occurs with impressive volume. Note how in Figure 1 the market not only breaks out above the upper boundary of the trend channel that began in mid-July, but does so with increased volume and gaps higher. The fact that the market is now attempting to find support on top of that upper boundary—turning what was resistance into support—is another sign that this market is capable of moving higher in the short term. |
| After my petit indicator-bashing at the open, I want to make sure I give my favorite indicators and setups their props. Figure 2 shows an hourly chart of the NASDAQ 100 with what I call my BOSO screen. Derived from the work of Price Headley (bigtrends.com), this screen helps catch markets that are making big moves—moves so big that those markets quickly become "overbought" or "oversold," turning many traders away at precisely the time that traders should begin to be more interested in them. The highlighted area shows what happened the last time the NASDAQ 100 made a stochastic breakout to the upside on the hourly chart. I point it out because it appears as if the NASDAQ 100 is poised to make a similar move here in late August. (For more on the BOSO screen, see my Working-Money.com article, "BOSO" from October 5, 2005.) |
Technical Writer for Technical Analysis of STOCKS & COMMODITIES magazine, Working-Money.com, and Traders.com Advantage.
| Title: | Technical Writer |
| Company: | Technical Analysis, Inc. |
| Address: | 4757 California Avenue SW |
| Seattle, WA 98116 | |
| Phone # for sales: | 206 938 0570 |
| Fax: | 206 938 1307 |
| Website: | www.Traders.com |
| E-mail address: | DPenn@traders.com |
Traders' Resource Links | |
| Charting the Stock Market: The Wyckoff Method -- Books | |
| Working-Money.com -- Online Trading Services | |
| Traders.com Advantage -- Online Trading Services | |
| Technical Analysis of Stocks & Commodities -- Publications and Newsletters | |
| Working Money, at Working-Money.com -- Publications and Newsletters | |
| Traders.com Advantage -- Publications and Newsletters | |
| Professional Traders Starter Kit -- Software | |
Click here for more information about our publications!
Comments
Date: 08/30/06Rank: 3Comment:

Request Information From Our Sponsors
- VectorVest, Inc.
- Executive Premier Workshop
- One-Day Options Course
- OptionsPro
- Retirement Income Workshop
- Sure-Fire Trading Systems (VectorVest, Inc.)
- Trading as a Business Workshop
- VectorVest 7 EOD
- VectorVest 7 RealTime/IntraDay
- VectorVest AutoTester
- VectorVest Educational Services
- VectorVest OnLine
- VectorVest Options Analyzer
- VectorVest ProGraphics v6.0
- VectorVest ProTrader 7
- VectorVest RealTime Derby Tool
- VectorVest Simulator
- VectorVest Variator
- VectorVest Watchdog
- StockCharts.com, Inc.
- Candle Patterns
- Candlestick Charting Explained
- Intermarket Technical Analysis
- John Murphy on Chart Analysis
- John Murphy's Chart Pattern Recognition
- John Murphy's Market Message
- MurphyExplainsMarketAnalysis-Intermarket Analysis
- MurphyExplainsMarketAnalysis-Visual Analysis
- StockCharts.com
- Technical Analysis of the Financial Markets
- The Visual Investor
