HOT TOPICS LIST
- MACD
- Fibonacci
- RSI
- Gann
- ADXR
- Stochastics
- Volume
- Triangles
- Futures
- Cycles
- Volatility
- ZIGZAG
- MESA
- Retracement
- Aroon
INDICATORS LIST
LIST OF TOPICS
PRINT THIS ARTICLE
by Gary Grosschadl
After peaking past $33 in 2004, this stock suffered a decline to $14.70 this summer. Now things are starting to look up again.
Position: Buy
Gary Grosschadl
Independent Canadian equities trader and technical analyst based in Peterborough
Ontario, Canada.
PRINT THIS ARTICLE
FIBONACCI
Symantec Rising Off Bottom
08/29/06 03:42:12 PMby Gary Grosschadl
After peaking past $33 in 2004, this stock suffered a decline to $14.70 this summer. Now things are starting to look up again.
Position: Buy
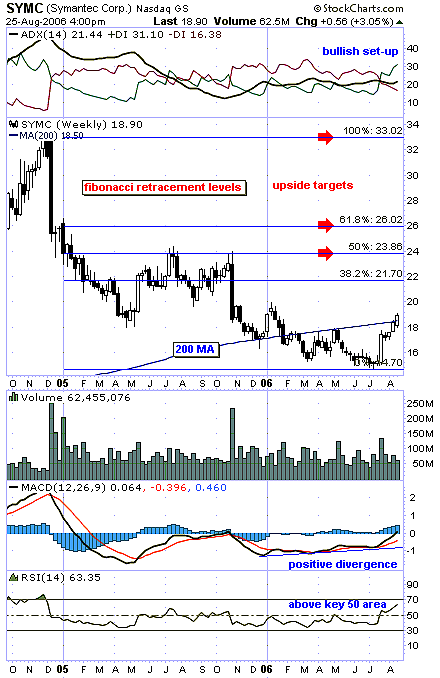
| Several weeks ago, Symantec (SYMC) raised eyebrows with a volume surge approaching 150 million shares and a two-point gain in share price for the week. After a two-week consolidation, it broke above the ever-important 200-day moving average (MA). This set the stage for probable higher gains. |

|
| FIGURE 1: SYMANTEC, WEEKLY. This chart of SYMC shows upside promise. |
| Graphic provided by: StockCharts.com. |
| |
| Several indicators are also considered on this weekly chart (Figure 1) to validate this surge above important overhead resistance. At the top of the chart, the average directional movement index (ADX) has started to upslope above the 20 level while the DIs (directional indexes) are bullishly poised. This suggests growing trend strength and a swing to bullish power. Below the chart we see positive divergence on the moving average convergence/divergence (MACD). As the share price drifted to new lows, this indicator was moving higher. This often points to a coming rise in prices. Finally, the relative strength index (RSI) or relative price index shows a move north of its often-key 50 area. This too hints at a change to bullish strength. |
| Fibonacci retracement levels are plotted using the high and low of the chart to muse upside targets. Three upside target areas are highlighted as they also relate well to previous areas of resistance. These areas are roughly $24, $26, and $33. Traders may anticipate trading targets or possible reversal levels at or near any of these levels. A close below the 200-day MA currently 18.50 would be bearish. |
Independent Canadian equities trader and technical analyst based in Peterborough
Ontario, Canada.
| Website: | www.whatsonsale.ca/financial.html |
| E-mail address: | gwg7@sympatico.ca |
Click here for more information about our publications!
Comments
Date: 08/29/06Rank: 5Comment:
Date: 09/03/06Rank: 2Comment:
Date: 09/06/06Rank: 4Comment:

Request Information From Our Sponsors
- VectorVest, Inc.
- Executive Premier Workshop
- One-Day Options Course
- OptionsPro
- Retirement Income Workshop
- Sure-Fire Trading Systems (VectorVest, Inc.)
- Trading as a Business Workshop
- VectorVest 7 EOD
- VectorVest 7 RealTime/IntraDay
- VectorVest AutoTester
- VectorVest Educational Services
- VectorVest OnLine
- VectorVest Options Analyzer
- VectorVest ProGraphics v6.0
- VectorVest ProTrader 7
- VectorVest RealTime Derby Tool
- VectorVest Simulator
- VectorVest Variator
- VectorVest Watchdog
- StockCharts.com, Inc.
- Candle Patterns
- Candlestick Charting Explained
- Intermarket Technical Analysis
- John Murphy on Chart Analysis
- John Murphy's Chart Pattern Recognition
- John Murphy's Market Message
- MurphyExplainsMarketAnalysis-Intermarket Analysis
- MurphyExplainsMarketAnalysis-Visual Analysis
- StockCharts.com
- Technical Analysis of the Financial Markets
- The Visual Investor
